Download
1 / 1
90 likes | 401 Views
Italy 28.0 Venezuela 13.0 Tunisia 11.7 Switzerland 10.1 Peru 9.5 United States 9.0 Greece 8.7 Chile 8.2 France 7.5 Sweden 7.0 Portugal 6.7 Czech Republic 6.5 Hungary 6.5

E N D
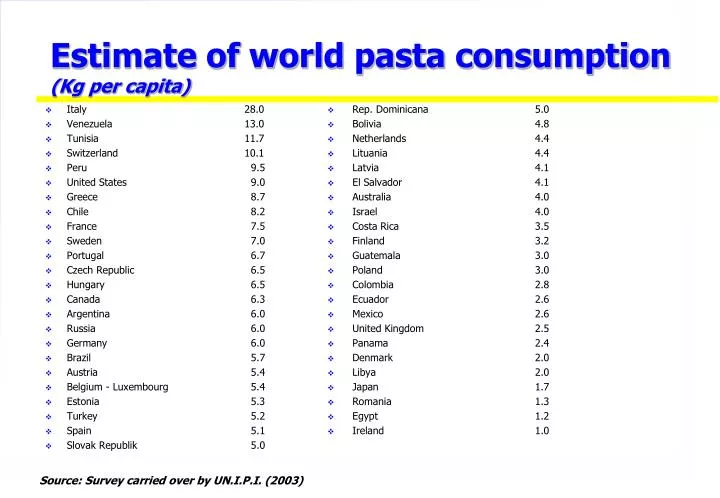
Italy 28.0 Venezuela 13.0 Tunisia 11.7 Switzerland 10.1 Peru 9.5 United States 9.0 Greece 8.7 Chile 8.2 France 7.5 Sweden 7.0 Portugal 6.7 Czech Republic 6.5 Hungary 6.5 Canada 6.3 Argentina 6.0 Russia 6.0 Germany 6.0 Brazil 5.7 Austria 5.4 Belgium - Luxembourg 5.4 Estonia 5.3 Turkey 5.2 Spain 5.1 Slovak Republik 5.0 Rep. Dominicana 5.0 Bolivia 4.8 Netherlands 4.4 Lituania 4.4 Latvia 4.1 El Salvador 4.1 Australia 4.0 Israel 4.0 Costa Rica 3.5 Finland 3.2 Guatemala 3.0 Poland 3.0 Colombia 2.8 Ecuador 2.6 Mexico 2.6 United Kingdom 2.5 Panama 2.4 Denmark 2.0 Libya 2.0 Japan 1.7 Romania 1.3 Egypt 1.2 Ireland 1.0 Estimate of world pasta consumption(Kg per capita) Source: Survey carried over by UN.I.P.I. (2003)