Download
1 / 5
50 likes | 150 Views
July Plan vs. September Stochastic Plan: Outages and commodities were updated Total TVA generation is similar September Plan is complimented by ranges in addition to traditional “point forecast”. FY 2010 Operating Cost ($000).

E N D
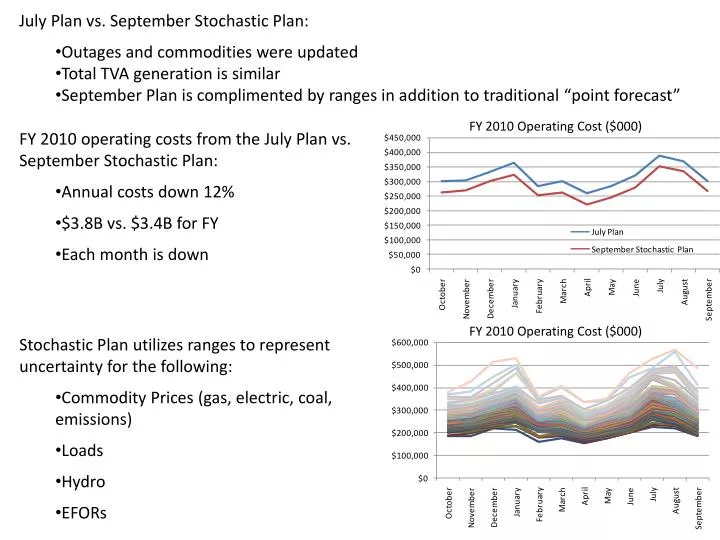
July Plan vs. September Stochastic Plan: • Outages and commodities were updated • Total TVA generation is similar • September Plan is complimented by ranges in addition to traditional “point forecast” FY 2010 Operating Cost ($000) • FY 2010 operating costs from the July Plan vs. September Stochastic Plan: • Annual costs down 12% • $3.8B vs. $3.4B for FY • Each month is down FY 2010 Operating Cost ($000) • Stochastic Plan utilizes ranges to represent uncertainty for the following: • Commodity Prices (gas, electric, coal, emissions) • Loads • Hydro • EFORs
July Plan vs. September Stochastic Plan: • Total generation levels are comparable both as a whole and for most fuel types • Coal is forecast to be down more than any other asset class • Most of the reductions are in the swing units • FY 2010 Coal Generation is down from the July Plan compared to the September Stochastic Plan: • PPAs, Spot Purchases, and CTs represent most of the forecasted shift • Volumes appear driven by lower gas and resulting power prices • Seasonal and monthly shifts are mostly even throughout the FY Changes in FY 2010 TVA Generation, GWh
Total TVA coal burn is ~ 1% different between the two plans… FY 2010 Total TVA Coal Burn, GBtu • FY 2010 TVA Monthly Burn • 881,480 GBtu in July Plan • 868,796 GBtu expected value in Stochastic September Plan • July Plan burns are greater for last 10 months of FY • This graphic could be duplicated by coal basin or stockpile • Total coal burn should be complimented with drivers and risks for big picture • Pluses and minuses can offset masking underlying challenges
Total TVA coal burn is ~ 1% different between the two plans…if100% contracted… • Paradise, Cumberland, and Shawnee would be “undersupplied” • Colbert 5 and Kingston 1 & 5 would be “oversupplied” • Future updates could include specific stockpiles and coal basins Potentially “oversupplied” Potentially “undersupplied” GBtus
Total TVA coal burn is ~ 1% different between the two plans, but the range is 30% FY 2010 Total TVA Coal Burn, GBtu • TVA FY 2010 Coal Burn • 881,480 GBtu in July Plan • 868,796 GBtu in September Stochastic Plan, expected value • Range of 747,153 to 971,698 in September Stochastic Plan • July Plan is near the 57th percentile • This information is available for stockpiles, coal basins, or total $