Download
1 / 33
330 likes | 489 Views
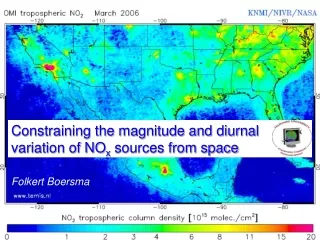
Satellite-detection and attribution of rapid increases in tropospheric ozone made in China and its influence on the western United States. Now also at. Folkert Boersma. A short story about ozone made in China. Submitted

E N D
Satellite-detection and attribution of rapid increases in tropospheric ozone made in China and its influence on the western United States Now also at Folkert Boersma A short story about ozone made in China Submitted Willem W. Verstraeten1,2,3*, K. Folkert Boersma1,2,3, Jason E. Williams1, Jessica L. Neu4, Kevin W. Bowman4 and John R. Worden4
Why do we care about ozone in the troposphere? 1. Ozone is an air pollutant – also in Europe I live here Impact of (SRES-A2) emissions (in ppb) 2030 – 2000 Loss in life expectancy in months Source:EU programme CAFE, CAFE Scenario Analysis Report Nr. 2. (Amann et al., 2004) Szopa et al., 2004
Why do we care about ozone in the troposphere? 2. Ozone is the 3rd most powerful cause of positive radiative forcing Shindellet al., 2009 O3 RF: 0.40 W/m2 CO2RF: 1.69 W/m2 …but uncertainty in ozone forcing (±0.20 W/m2) higher than for CO2 and CH4
Why do we care about ozone in the troposphere? 3. Ozone drives the oxidative capacity of the atmosphere O3 + hv O2 + O(1D) O(1D) + H2O 2 OH OH is the “detergent” of the atmosphere, determining lifetime of CH4, CO, and many other pollutants Need to understand ozone to improve our understanding of OH and possible trends therein Model-result: OH very difficult to measure!
How is ozone formed in the troposphere? Lifetime tropospheric O3: a few weeks STE
IPCC AR5-reported trends in tropospheric ozone • IPCC conclusions • Ozone increases over Europe and eastern USA have levelled off • Ozone has likely increased over eastern Asia since the 1990s
Ozone increases over western United States EU air quality standard Cooper et al., 2008 • Compile and analyse large dataset (1984-2008) of ozone measurements over the western United States • Ozonesondes, lidar, aircraft measurements
Unclear where that ozone came from LOW OZONE CONDITIONS High ozone tends to originate from deep within Asia Ozone monitoring in the free troposphere since the 1970s is very limited. What can satellite instruments tell us? HIGH OZONE CONDITIONS
Satellite instruments: TES and OMI Observes NO2 in VIS Observes ozone in thermal IR Broadly sensitive to free tropospheric ozone l2 l1 elIl(T1) T1 Sensitive to NO2 down to the surface absorbing gas blackbody radiation Scattering by Earth surface and by atmosphere Il(T0) To Surface Surface
Vertical sensitivity OMI: sensitivity down to surface 464 hPa averaging kernel: Broad sensitivity to free tropospheric ozone
Validation and use of TES ozone retrievals Global map of summertime tropospheric ozone from TES (@464 hPa) JJA 2005-2010 464 hPa Strong precursor emissions! + photochemical activity
Validation and use of TES ozone retrievals Global validation with WOUDC ozone sondes for period of 6 years Verstraeten et al., AMT, 2013 • Insignificant trend in TES-sonde bias at midlatitudes • TES can be safely used for temporal analysis
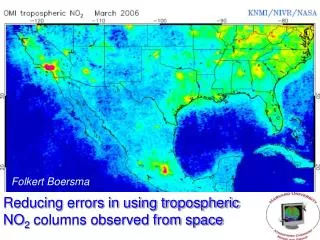
OMI tropospheric NO2 retrievals Strong precursor emissions!
Increase in Summertime tropospheric O3 and NO2observed by TES and OMI over China 2005-2006: May-August 2009-2010: May-August 2010-2005 Difference TES 464 hPa • TES: Strong increase in FT ozone over and downwind of China • OMI: Strong increase in BL NO2 pollution over China Increase of 1.1 ppbvozone/yrat 464 hPa Increase of 1.1 ppbv/yr ozone
Increase in tropospheric O3observed by TES over western United States TES 3-9 km partial ozone column 2009-2010 Also increasing but not at a statistically significant pace
Interpretation of the increases with TM5 CTM Research Question 1: Can emissions explain the increase in FT O3 over/downwind of China? 3-D global chemistry transport model • 34 vertical layers (surface-0.1hPa), 3˚×2˚ • ECMWF meteorological fields (ERA-interim) 2TM5 simulations: Invariable NOx emissions OMI-constrained NOx emissions • Emission inventories: • Anthropogenic inventories: RETRO project + REAS inventory for Asian • Lightning NOx emissions: ~5 Tg N/yr • Biomass burning emissions: GFEDv2 • Tropospheric chemistry: 42 species and > 60 reactions (CBM-IV) • Reference: Huijnen et al., 2010.
OMI-constraints on NOx emissions (2005-2010) • Update a priori emissions to follow OMI-observed trend • Update for all grid cells (no smearing) • Take into account non-linear sensitivities to chemical regime New top-down emissions Change in year j relative to 2006 in NO2 observed with OMI A priori emissions NO2 Sensitivity of NO2 column to changing emissions
Taking into account chemical regime (β) Evaluate TM5 response to perturbing NOx emissions (Lamsal et al., 2009): β=1: linear local response between NOx and NO2 column β>1: Rapid negative feedback on NO2 via increased OH β<1: Accumulation of NO2 in response to emissions Increasing emissions by +15% In winter: β<1 (long lifetime NO2) In summer: β>1 (enhanced loss) JANUARY JULY
OMI-constrained NOx emissions (2010-2005) Clean-up of USA, Europe and Japan Strong increases in Asia
OMI-constrained NOx emissions over China (2010-2005) TM5 with OMI emissions captures OMI time series
Reproducing the TES-observed O3 increase over China TM5 with updated OMI emissions better captures TES time series But substantial increase also in TM5 simulation with constant NOx emissions
Stratosphere-troposphere exchange (STE) over China Research Question 2: What is the role of stratosphere-troposphere exchange? • Use TM5 • Stratospheric ozone in TM5 is constrained by 30-year (assimilated) 14-satellite dataset of total ozone • (van der A. et al., ACP, 2010) • Net stratosphere-troposphere exchange is governed by ECMWF meteo + MSR constraints • STE can be tracked in TM5 with tagged tracer ‘O3S’ Overall O3 increase O3 increase due to STE 2010-2005 difference China 2010-2005 difference China
Stratosphere-troposphere exchange (STE) Deseasonalized changes in tropospheric ozone • Answers to Research Questions: • STE and increasing NOxboth explain the observed increase over China • STE stronger effect From subtracting TM5 simulations 1 and 2 (same STE)
What is happening with O3 over the western United States? TES 3-9 km partial ozone column 2009-2010 Also increasing but not at a statistically significant pace
Reduced NOx emissions … Substantial reductions in NOx emissions over the western USA (-12% between 2005-2010) …but also strong O3 increase due to STE over the western USA O3 increase due to STE Overall O3 increase STE associated with enhanced stratospheric circulation in response to vigorous El Nino & QBO in 2010 relative to 2005
2005-2010 ozone changes over the western US Deseasonalized changes in tropospheric ozone: increase! • TES indicates increase over western US • In spite of local decreases in NOx • STE masks out effects reductions in anthropogenic NOx emissions How much of the western US ozone increase originated from China?
Compare two 6-year TM5 simulations 2. TM5 with OMI-constrained NOx emissions throughout the world 3. As (2) but with constant REAS-2006 NOxemissions over China Change in Anthropogenic NOX emissions between 2010 and 2006 Difference between (2) and (3) indicative of the effect of increasing Chinese NOx emissions on western United States
ΔO3 due to increasing Chinese NOx emissions Western US O3 increases by +0.2 ppbv at ±6 km because of large-scale transport & sustained O3 production driven by decomposition of nitrogen reservoirs in descending air masses ΔO3 between 2010 and 2005 at ~460 hPa (±6km) Western US O3 increases by +0.1 ppbv at ±1 km because of +15% Chinese NOx emission increases ΔO3 between 2010 and 2005 at ~900 hPa (±1 km)
ΔO3 due to increasing Chinese NOx emissions Deseasonalizedtimeseries 3-9 km correcting for STE and local effects FT (3-9 km) O3 increases by 0.01 DU/yr (0.1%/yr) This import neutralizes one-third of the O3 decreases related to reduction in surface emissions due to stricter air pollution policies.
Discussion • Combined use of TES and OMI provides a new perspective on changing tropospheric composition in 2005-2010 • TES observes a 10% increase in 6 years in FT O3 over China • Supported by TM5 when OMI-constrained NOx (+2%) and STE changes (+8%) are accounted for • TES indicates a 4% increase in FT O3 over western US • Policy-driven NOx reductions alone would have reduced O3 (-1%) over the western US in the absence of other effects • STE (+5%) and import of ozone made in China (+0.5%) offset local policy measures
Support for increased STE over China throughout 2005-2010 Wang et al, 2012, ACP --- Sonde: influenced by photochemical production and STE --- Model (CLaMS): only STE OZONE SONDES OVER BEIJING