Download
1 / 16
160 likes | 163 Views
Constraining the magnitude and diurnal variation of NO x sources from space. Folkert Boersma. Blond et al. (2007). SCIAMACHY. EMEP. Major uncertainty in models: emissions of NO x. What is so uncertain about emissions? quantities locations times trends.

E N D
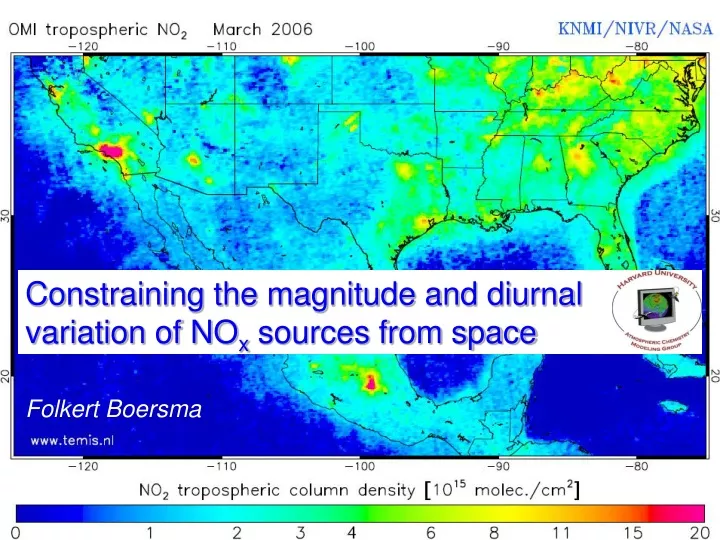
Constraining the magnitude and diurnal variation of NOx sources from space Folkert Boersma
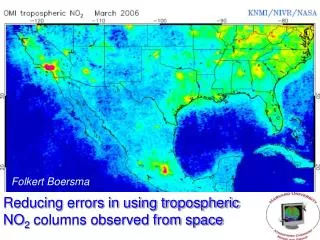
Blond et al. (2007) SCIAMACHY EMEP Major uncertainty in models: emissions of NOx • What is so uncertain about emissions? • quantities • locations • times • trends But we can see the NOx sources from space • Examples of recent work: • use OMI satellite observations to estimate emissions over the U.S. and Mexico • use SCIAMACHY and OMI to illustrate importance of timing emissions Emissions
NO2 Ozone Monitoring Instrument • Data since September 2004 • Nadir-viewing instrument measuring direct and atmosphere-backscattered sunlight from 270 – 500 nm • Wide field of view (2600 km) global coverage in one day • Nadir pixel size 24 x 13 km2 • Local overpass time 13:30 hrs
Sunday Saturday
Weekend effect observed from GOME Sunday NO2 levels 25-50% lower than weekday levels
EPA NEI99 emissions in use in GEOS-Chem Industry (17%) Power Plants (25%) ‘Other’ (21%) Transport (36%)
TOP-DOWN r2 = 0.86 (n=118) Top-down lower over industrial Midwest Top-down higher over northeastern United States OMI BOTTOM-UP
March 1999 – 2006: +3.2% (2.9%) Regression bottom-up categories to these differences: Transport: +33% 22% Power Plants: -25% 23% Industry: -26% 30% Other: +9% 40%
Diurnal variation of NO2 columns NNO2: NO2 column (t): NO2:NOx ratio E(t): NOx emissions k(t): NOx loss rate NNOx: NOx column E k
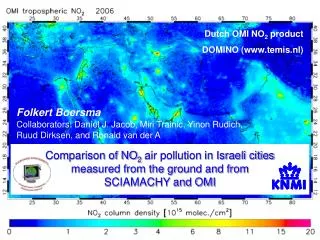
Diurnal variation of NO2 columns • Grid SCIAMACHY and OMI NO2 observations on 0.5 x 0.5 grid • Take only those grid cells that were cloud-free for both instruments • Compute monthly averages SCIAMACHY: 10.00 local time OMI: 13.30 hrs local time
Difference SCIAMACHY – OMI tropospheric NO2 r = 0.76 (n = 1.9×10⁶) SCIAMACHY 10-40% higher than OMI for most anthropogenic source regions SCIAMACHY lower than OMI for biomass burning regions
Simulating 10am to 1:30pm with GEOS-Chem Relative decrease in NO2 column from 10am to 1:30 pm Observed GEOS-Chem US: -18% -31% EU: -5% -30% China: -37% -29%
2003 2005 Biomass burning mainly in afternoon 2001 2002 2004 Relative increase in NO2 column from 10am to 1:30 pm Jun Wang Observed GEOS-Chem Africa: +31% +16% Indon.: +35% +11% Brazil: +37% -2%
Conclusions Conclusions • Decreasing power plant NOx emissions (-20%, 1999-2006) • Evidence for increasing mobile emissions (+30%, 1999-2006) • 2. SCIAMACHY and OMI observe • - fast photochemistry • - fast emission changes from space
Credits Daniel Jacob Henk Eskes (KNMI) Rob Pinder (EPA) Jun Wang Ronald van der A (KNMI) Bob Yantosca Rokjin J. Park