Download
1 / 8
80 likes | 160 Views
Supplemental Figures. Positive Correlation of STAT1 and miR-146a with Anemia in Patients with Systemic Lupus Erythematosus Paul R. Dominguez Gutierrez 1 , Angela Ceribelli 1 , Minoru Satoh 2,3 , Eric S. Sobel 2 , Westley H. Reeves 2 and Edward K.L. Chan 1*

E N D
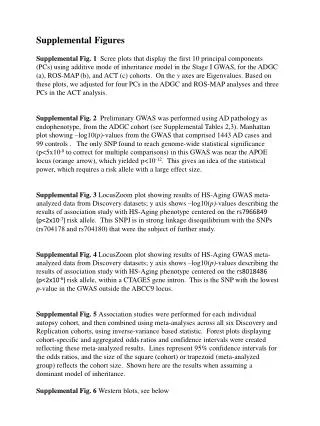
Supplemental Figures Positive Correlation of STAT1 and miR-146a with Anemia in Patients with Systemic Lupus Erythematosus Paul R. Dominguez Gutierrez1, Angela Ceribelli1, Minoru Satoh2,3, Eric S. Sobel2, Westley H. Reeves2 and Edward K.L. Chan1* 1Department of Oral Biology, University of Florida, 1395 Center Drive, Gainesville, Florida 32610-0424, USA, 2Department of Medicine, University of Florida, 1600 SW Archer Rd., Gainesville, Florida 32610-0221, USA, 3Department of Pathology, Immunology, and Laboratory Medicine, University of Florida, 1600 SW Archer Rd., Gainesville, Florida 32610-0275, USA
Supplemental Figure 1 Supplemental Fig. 1 The composition of gender by individual (A) and by visit (B) were plotted for both HD and SLE patients. Similarly, the ethnic composition of both HD and SLE patient were plotted by visit (C). The therapy regimen per visit were plotted (D). SLE patients were significantly older than the HD (E).
Supplemental Figure 2 Supplemental Fig. 2 Demographic data of SLE patients and healthy donors. (A,B) Patients and healthy donors were composed of African Americans (AA), Asian Americans (AsA), European Americans (EA), Latin Americans (LA), and Multiethnic Americans (MA). (C) Of the 78 patients receiving prednisone (PDN), the median dose was 12.5 mg/day and 102 patients did not receive any PDN. (D) For (E), For hydroxychloroquine (HCQ), 124 patients were receiving a median dose of 400 mg.day and 56 patients were not receiving any HCQ. (E) For mycopheloatemoefetil (MMF), 71 patients were receiving a median dose of 3000 mg/day and 109 patients were not receiving MMF.
Supplemental Figure 3 Supplemental Fig. 3 The relationships of miR-146a, STAT1, and SLEDAI in non-anemic versus anemic patients were essentially unchanged considering different methods of selecting only a single visit for patients with multiple visits. (A-C) Data from the first visit of the 58 patients with multiple visits were analyzed together with the 43 patients with single visits. (D-F) Similar to the above except the data from first visit was substituted by data from the second visit of the 59 patients with multiple visits. (G-I) For the 59 patients with multiple visits, data from visits positive for anemia were selected for analysis.
Supplemental Figure 4 Supplemental Fig. 4The relationships of miR-146a and STAT1 versus SLEDAI and anemia were analyzed including only data from one visit for each patient and of those with multiple visits only anemia-positive visits were included. (A) Only anemic patients displayed significantly higher miR-146a than non-anemic patients in the inactive group. (B) Similarly for STAT1, only anemic patients displayed significantly higher level than non-anemic patients in the inactive group.
Supplemental Figure 5 Supplemental Fig. 5 African Americans SLE patients were more likely anemic and SLE patients with anemia were more likely under prednisone therapy. (A) A contingency plot of African Americans (AA) and European Americans (EA) to compare anemic and non-anemic SLE patients showed that anemic patients are more likely to be AA than EA. (B) A contingency plot of patients receiving and not receiving PDN showed that anemic patients were more likely to be receiving PDN than non-anemic patients.
Supplemental Figure 6 Supplemental Fig. 6The relationships of miR-146a and STAT1 versus anemia and therapy were analyzed including only data from one visit for each patient and of those with multiple visits only anemia-positive visits were included. SLE patients were separated into treated (Tx) and untreated (UTX) patients with and without anemia. Only anemic patients displayed significantly higher miR-146a (A) and STAT1 (B) than non-anemic patients in the Tx group.
Supplemental Figure 7 Supplemental Fig. 7No significant correlation was observed for STAT1 (A) and miR-146a (B) with age for either HD or SLE patients with or without anemia.