Download

1 / 17
170 likes | 265 Views
Supplemental Figures Byrne et al. Metabolic vulnerabilities in endometrial cancer.

E N D
Supplemental Figures Byrne et al. Metabolic vulnerabilities in endometrial cancer.
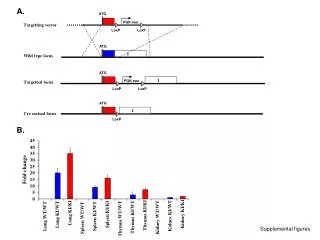
Figure S1. Protein expression in human endometrial tissue. (A) Summary of protein expression in endometrial tumor tissue relative to normal adjacent tissue for each of the 6 patients (from Figure 1C, D and F). Protein expression was quantified for each sample using Odyssey software (LI-COR). Green indicates tumor protein expression higher than 1.5-fold compared to matched non-tumor tissue, while red indicates tumor protein expression lower than 0.5-fold compared with matched non-tumor tissue. *indicates the phosphorylation of proteins relative to total protein expression. GT= glucose transporter. (B) The expression of other metabolic regulatory proteins in tumor (T) and normal adjacent (N) endometrial tissue (6 patients total). 14-3-3 serves as a protein loading control.
Figure S1. A N N N N N N T T T T T T 4 3 2 1 6 5 B PPARγ Transcriptional regulator Pentose Phosphate Pathway G6PD TSC2 mTOR signaling pS6K LKB1 Loading control 14-3-3
Figure S2. GLUT6 expression in human endometrial tissue. Matched tumor and non-tumor endometrium from 2 obese postmenopausal women. GLUT6 staining is strong in blood vessels (arrow heads) of the non-tumor endometrium (left panel). Strong GLUT6 staining is evident in cancerous glandular epithelial cells (E), blood vessels (arrow heads), and weaker staining is seen in stromal cells (S) in the Type I (endometrioid) tumors.
Figure S2. Non-tumor Endometrium Endometrioid Tumor E S Patient A E S 100µm S E S Patient B E
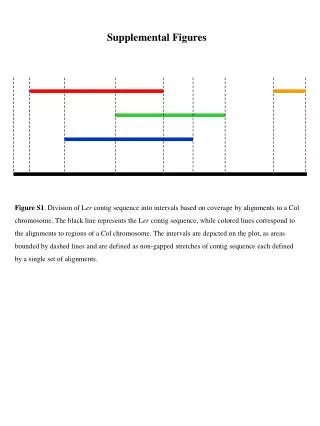
Figure S3. Correlation between metabolic protein expression and metabolism in endometrial cells. Protein expression (average of 3 independent immunoblots) was evaluated in human endometrial cancer (HEC, ISH, 296, 319, AN3, KLE, RL) and non-cancerous epithelial (hUE) and stromal (MAD) cells and was analyzed for correlations with glucose metabolism; glucose oxidation (pmol14C-glucose to 14CO2/min/mg protein), glycolysis (pmol 3-3H-glucose to 3HOH/min/mg protein), or glucose metabolism to lipid (pmol14C-glucose to 14C-lipid/min/mg protein). Metabolic assays represent the mean (±SEM) of 3 technical replicates (experiments were performed at least twice). Pearson correlation coefficients (r values) and significance (p values) were calculated using GraphPad Prism software. GLUT6 protein expression correlated with Warburg metabolism [low glucose oxidation (glucose->CO2)/high glycolysis (glucose->H2O) ratio] (A). The phosphorylation of Akt (pAkt/Akt) correlated with glycolysis (B) and glucose conversion to lipids (C).
Figure S3. hUE Epithelial MAD Stromal HEC ISH 296 Cancer 319 AN3 KLE RL A C B
Figure S4. GLUT6 knockdown in endometrial cancer cells induces cell death. (A)296 cells were transfected with control siRNA (Ctrl), a pool of 4 GLUT6 siRNA sequences (Pool), or each of the 4 individual GLUT6 siRNA sequences separately. Maximum GLUT6 protein knockdown was observed using Sequence 4 siRNA (Seq.4), 96 hr post-transfection. β-actin served as a protein loading control. (B) GLUT1, GLUT4 and GLUT8 mRNA expression were not significantly altered in 296 cells transfected with GLUT6 Pool siRNA, compared with controls. (C) Representative micrographs showing 296 cell death (dynamic membrane blebbing) following GLUT6 knockdown with Seq.4 siRNA. (D) RL cells were transfected with siRNA as described in (A). (E) GLUT6 knockdown reduced viable RL cell counts by 59% (Pool siRNA) and 83% (Seq.4 siRNA) at 96 hr post-siRNA transfection, compared with controls. (F) GLUT6 knockdown increased sub-G1 cell populations, as determined by cell cycle analysis (80 hr post-transfection). Sub-G1 populations are indicated (red bar) and population counts are shown within the histogram. (G) GLUT6 knockdown increased the number of Annexin V positive (AV+) cells (80 hr post-transfection). Data are presented as percentage of total cells (AV+ plus AV-). (H) LDH release in GLUT6 siRNA-transfected RL cells was calculated as a fold-increase of controls, 96 hr post-transfection. All data represent the mean of at least three independent experiments ± SEM (*p<0.05). NS= not significant.
Figure S4. A Individual siRNA Sequences B Ctrl Pool 1 2 3 4 GLUT6 β-actin 34hr 40hr 46hr 296 C CTRL Seq.4 Pool siRNA Seq.4 20µm E D siRNA Seq.4 Ctrl Pool GLUT6 β-actin F 1.26±0.07 3.11±0.26 16.97±1.03 Seq.4 Ctrl Pool siRNA * * RL Seq.4 Ctrl Pool Counts DNA content G H
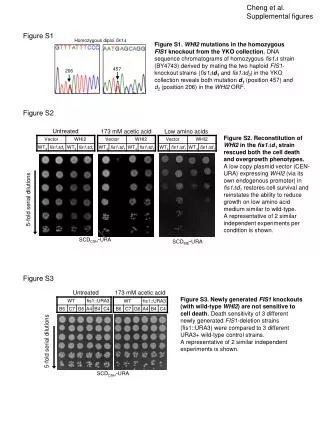
Figure S5. Correlation analyses for drug sensitivity. (A)Population doubling time of human endometrial cells (hours). Data represent the mean of 3 biological replicates (±SEM). (B) Population doubling time of endometrial cells significantly correlates with their sensitivity to paclitaxel (IC50 nmol/L). (C) MCT1 protein expression in human endometrial cell lines. 14-3-3 serves as a loading control. (D) Endometrial cell sensitivity to BrPA [(BrPA IC50 (µM)] did not significantly correlate with MCT1, HK2 and GAPDH protein expression. Representative western blots for these analyses are shown in Figures 2A and S5C. Arbitrary protein expression scores were given to each cell line (mean value from 3 independent lysates and blots), with the highest expressing cell line for each protein given a score of 1 (red color shading). The lowest protein expression is represented by blue color shading. Pearson correlation coefficients (r values) and significance (p values) were calculated using GraphPad Prism software.
Figure S5. Cancer Epithelial Stromal A B MAD KLE AN3 319 ISH 296 hUE HEC RL hUE Epithelial MAD Stromal HEC ISH 296 Cancer 319 AN3 KLE RL MAD RL 296 319 AN3 KLE hUE HEC ISHI Cancer Stromal Epithelial D C MCT1 14-3-3
Figure S6. Precursor Ion Scan of Pyruvylated-CoA. A sample of the solution in which CoA and BrPA were allowed to react, was analyzed by a Product Ion Scan. Low collision energy was used to observe both the parent and the product ions. Observed peaks correspond to the calculated masses that can be predicted using published data for CoA (Burns et al., 2005). The parent and the sulfur-containing ions of CoA were increased by 86 m/z units upon reaction with BrPA, whereas the m/z 428 ion remained unchanged indicating that the pyruvylation reaction occurred at the sulfur atom.
Figure S7. Antioxidants (without thiol groups) could not protect against 3-bromopyruvate-mediated cell death. (A)CMH2DCFDA-loaded 296 cells were treated with BrPA (100µM) and the change in fluorescent signal was measured at the indicated time points (% increase of untreated cells). (B) Representative micrographs (phase contrast and GFP filter) of 296 cells loaded with CMH2DCFDA and left untreated or treated with BrPA (100µM). (C-I) 296 cells were pretreated with apopcynin (300µM), allopurinol (1mM), L-NAME (100µM), MnTBAP (100µM), Mito-tempo (100µM), resveratrol (20µM) and L-ascorbic acid (100µM) for 30 minutes prior to treatment with increasing doses of BrPA. Cell viability (MTT assay) was determined 48 hours later.
Figure S7. A B Phase contrast GFP Untreated 400μm BrPA D C Apocynin Allopurinol E G F L-NAME MnTBAP Mito-tempo I H Ascorbic acid Resveratrol
Figure S8. ATP levels and cell death induced by 3-bromopyruvate. (A) ATP levels in 296 cells untreated or treated with 100 µM BrPA for the indicated times. (B) Representative micrographs of UV-irradiated 296 cells with or without Q-VD-OPH (QVD) at time zero (0 hr) and 6 hrs. (C) LDH release at 18hrs in RL cells treated with 250µM 3-bromopyruvate (BrPA) (+/-QVD) or UV-irradiated (+/-QVD). LDH release is calculated as a % increase of untreated cells. Data represent the mean of at least three independent experiments (error bars ± SEM) (*p<0.05). NS= not significant.
Figure S8. 0hr 6hr 20μm B C A UV UV+ QVD