Download
1 / 15
160 likes | 305 Views
Characterization of E-Cadherin Distribution from Fluorescence Images . J. Miguel Sanches 1,2 , Joana Figueiredo 3 , Isabel Rodrigues 1,3 , Raquel Seruca 3

E N D
Characterization of E-Cadherin Distribution from Fluorescence Images J. Miguel Sanches1,2, Joana Figueiredo3, Isabel Rodrigues1,3, Raquel Seruca3 1Institute for Systems and Robotics, 2Department of Bioengineering-Instituto Superior Técnico / Technical University of Lisbon, Portugal 3Instituto Superior de Engenharia de Lisboa (ISEL) 4IPATIMUP - Institute of Molecular Pathology and Immunology of the University of Porto, Portugal Bioimaging, Porto, September 20-21, 2012
Cell Adhesion Physical linkage between cells is the basis of structural mechanical properties of the tissues, e.g, epithelial tissues Bioimaging, Porto, September 20-21, 2012
Aberrant adhesion • Cellsbecomenon-adherentandgainanincreaseability to invade thesurroundingtissue, e.g., cancer Bioimaging, Porto, September 20-21, 2012
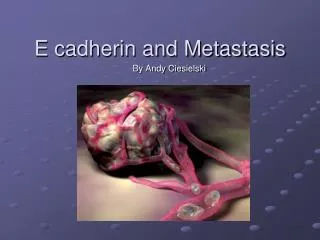
E-Cadherin • E-cadherin is a central protein in cell-cell adhesion. • Mutations on E-Cadherin gene (CDH1) lead to a dysfunctional molecule. • These mutations are involved in epithelial cancer progression. Bioimaging, Porto, September 20-21, 2012
E-Cadherin Distribution The distribution of E-Cadherin molecule in normal cells is mainly observed at the membrane, where it plays its role in cell-cell adhesion. Normal stomach tissue Bioimaging, Porto, September 20-21, 2012
Fluorescence Imaging E-Cadherin distribution can be observer in epithelial cell line labeled with E-Cadherin tagged anti-body Light Epithelial cell line expressing E-cadherin Bioimaging, Porto, September 20-21, 2012
E-Cadherin MutationsCell distribution E- cadherinNeg WT T340A A634V E757K R749W E781D V832M P799R Bioimaging, Porto, September 20-21, 2012
Key features Bioimaging, Porto, September 20-21, 2012
E-Cadherin distribution characterization • Pre-processing and semi-automatic cell selection • Image radial profiles computation • Compensation for geometric distortions • Features extraction and distribution characterization Bioimaging, Porto, September 20-21, 2012
Cell centroid estimation and semi-automatic selection • Centroids selection and computation Bioimaging, Porto, September 20-21, 2012
Image of intensity profiles Bioimaging, Porto, September 20-21, 2012
Geometric compensation • Each profile (column) is modeled as a finite dimension 1D continuous function estimated by imposing similarity among columns • The locations, x, of the original observations are adjusted in this continuous space according an energy function Bioimaging, Porto, September 20-21, 2012
Distribution characterization • Image profiles - 2D based characterization • Prototype profile estimation 1D based characterization Bioimaging, Porto, September 20-21, 2012
Conclusions • Distribution of E-Cadherin protein across the cell from fluorescence images of microscopy • Characterization metrics for discrimination for CDH1 gene mutations • Radial E-Cadherin prototype distribution • Geometry invariant Bioimaging, Porto, September 20-21, 2012
Thank you J. Miguel Sanches (jmrs@ist.utl.pt) Bioimaging, Porto, September 20-21, 2012