Download
1 / 18
190 likes | 200 Views
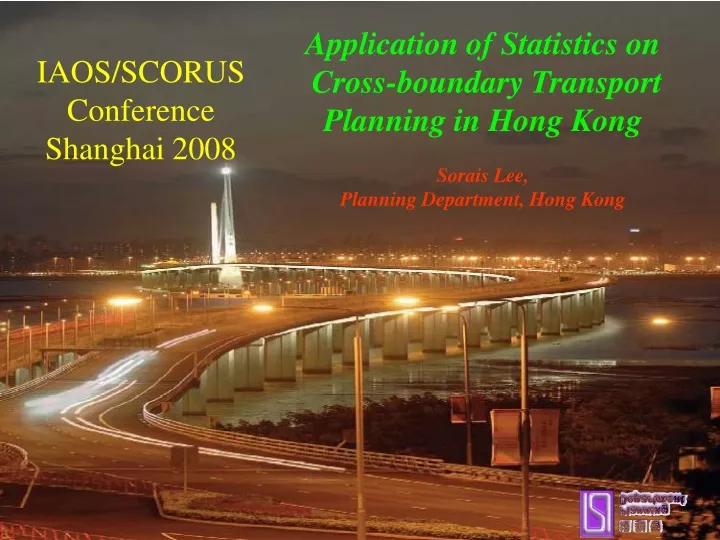
IAOS/SCORUS Conference Shanghai 2008. Application of Statistics on Cross-boundary Transport Planning in Hong Kong Sorais Lee, Planning Department, Hong Kong. Application of Statistics on Cross-boundary Transport Planning in Hong Kong. Ties between Hong Kong and the Mainland

E N D
IAOS/SCORUS Conference Shanghai 2008 Application of Statistics on Cross-boundary Transport Planning in Hong KongSorais Lee, Planning Department, Hong Kong
Application of Statistics on Cross-boundary Transport Planning in Hong Kong • Ties between Hong Kong and the Mainland • Administrative information • Cross-boundary Travel Surveys • The Projection Model • Other sources of information
Major Control Points in Hong Kong Lo Wu Terminus Lok Ma Chau Spur Line Control Point Man Kam To Control Point Lok Ma Chau Control Point Sha Tau Kok Control Point Shenzhen Bay Control Point Tuen Mun Ferry Terminal Hong Kong International Airport Hung Hom Station China Ferry Terminal Macau Ferry Terminal N
140% Close Ties between Hong Kong and the Mainland
Daily Passenger Trips by Land Control Point No. of trips ( x 1000) Lo Wu has major share. LMC increases fast
Average Daily Trips by Passenger Type(during the two-week period in Nov/Dec) Average annual growth rate 03-06 06-07 3% 6% 19% 18% 2% 29% 23% 1% No. of trips ( x 1000)
Trip Rate of Usual Residents by Sex Number of Daily trips per 1000 Usual Residents
Trip Rate of Usual Residents by Sex Number of Daily trips per 1000 Usual Residents
60% Daily Vehicle Trips by Control Point(figures for the whole year and based on administrative records) No. of trips 41757 30989 26050 15694 8429 6901 1927 3103 2297
Daily Vehicle Trips by Vehicle Type(figures for the whole year and based on administrative records) Average annual growth rate 97-04 04-07 6% 2% 2% 0% 23% 15% 3% - 5% 23% - 4% 33% 7% No. of trips
Private Car Quota and Trip Rate(figures for the whole year and based on administrative records) Quota Approved (left scale) Trip Rate (right scale) 0.47 trip per day per quota 0.73 trip per day per quota
Sources of Data • Administrative data from government departments • Census and Statistics Department • Immigration Department • Customs and Excise Department • Marine Department • Civil Aviation Department
Sources of Data • Administrative data from government departments • Passenger Flows by Control Point by Direction • Vehicle Flows by Control Point by Direction • Passenger Movement Records • Vehicle Movement Records No information on • Purpose of trip • Destination / origin • Mode of transport
Cross-boundary Travel Surveys • Surveys in 1999, 2001, 2003, 2006 and 2007 (supplementary vehicle survey in 2004) • 2 weeks survey period in Nov/Dec • Method – randomly select passengers and drivers and intercept them to conduct face-to-face interview • Covers passenger and vehicle trips • Covers all major control points – land, sea, air
4-Stage Transport Model 8 series of passenger trips by type by purpose OD flow volumes Share among transport modes Route selection process Population and Employment Forecasts Trip Generation Trip Distribution Transportation Network and Service Attributes Iteration Modal Split Trip Assignment Link and O-D Flows, Times, Costs, etc
Cross-boundary Transport Model Structure Hong Kong Domestic Transport Model Planning Data Local Loaded Networks Guangdong Loaded Networks Public Transport Networks Highways Networks Public Transport Model Total Public Transport Demand Freight Model Private Vehicle Model Highways Model Modal Split Goods Vehicle and Container Vehicle Demand Matrices Private Vehicle Demand Matrix Cost Elasticity Model Through Train, Boundary Train, Bus, Ferry Person Matrices Highway Loading by Crossing Point Public Transport Loading Bus Vehicle Flows Highway Loaded Network
Overview of sources of information Historical data • Administrative statistics Statistical surveys • Administrative movement records • Cross-boundary Travel Surveys Planning data • Survey on Propensity to Use Private Cars to Cross the Boundary, 2005 • Transport-related information • Mainland-related information • Planning and development information • Government policies • Thematic household surveys on Hong Kong people’s experience of and aspirations for taking up residence in the Mainland • Joint study with three neighbouring cities (Shenzhen, Macao, Zhuhai) of Hong Kong • Survey on Hong Kong people living in Shenzhen