Download
1 / 17
170 likes | 325 Views
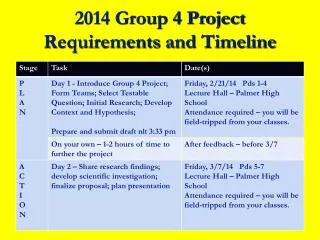
Group 4 Project. WATER The Cool Three and Casper The Ghost Rouchdi Caspar The Ghost Maru Celine . Method. Choose station Measure velocity at two separate depths (using 3 measurements and then finding an average) Measure temperature, light intensity, relative humidity

E N D
Group 4 Project WATER The Cool Three and Casper The Ghost Rouchdi Caspar The Ghost Maru Celine
Method • Choose station • Measure velocity at two separate depths (using 3 measurements and then finding an average) • Measure temperature, light intensity, relative humidity • Move on to next station further downstream and repeat experiment.
Data on factors affecting the flora plant diversity along the stream Light intensity: measured by the water. Reflections from the water is a source of light for the nearby growing plants , which is a reason many smaller plants thrieved. Relative humidity of soil: Taken close to the river bank, by the flora recorded. The more clay like the soil, the less humid. Temperature: Taken in the water on the riverbed, same location as where the light intensity is measured (not where velocity is) . The first result is high because there was still water, which the sun had longer time to heat. There was expected a correlation between light intensity and water temperature, but none was found. Shadow influenced the temperature. This could because of relatively still water benefitting from the albeedo effect.
Velocities (m/s) Depths
Conclusion Results The water velocity is greater at the surface because the water has less obstacles and less resistance. This affected the plant life by making the leaves shorter and stronger along the surface. Such as moss. It also showed signs of having eroded the banks and rocks, usually leaving a clear line where plant life stopped growing due to the faster water currents.
pH of water and Soil • The average of the pH for soil was 6.67 • The Average of the pH for water was 7.22
Observations on pH value: • The redder the soil, the more acidic. • Dead organic matter didnt influence the pH values as expected Was there a correlation between Soil pH and humidity?
Correlation between Humidity and Acidity Hypothesis: There is a significant correlation between soil humidity and soil pH Null hypothesis: There is a significant correlation between soil humidity and soil pH Using Speaman’s rank: • 1-(114/336)= .6608 No correlation= we have to accept the null hypothesis
Limitations and improvements. • Physics: water was sometimes too shallow due to little recent rainfall influencing the width and depth of the water, so the propeller did not go round correctly. Rocks were in the way, which resulted in us altering the landscape by moving them –this is a source of error . A smaller propeller on the equipment used would solve this problem .Other groups up-stream can have influenced it the velocity, and our group members positioning in the process of collecting data, this could be helped by returning on a different day, or again, a different site. The width of the river wasn’t measured, and the length of the river also not considered a variable.
Biology/ESS:Our Sampling strategy was hindered because our chosen sites depended on accessibility and could therefore not follow the systematic sampling strategy initially wanted. The lack of rainfall could also have influenced the amount of plant life, as some of the riverbank had become quite exposed by this (returning another time could give a different bio diversity) . This has influenced the riverbank as a habitat, and the velocity of the water. Human activity as also disturbed the site, as much wildlife has probably fled at our (the various groups) approach, next time a more secluded site should be chosen. The places from which the samples came were not collected so that anything could be stepwise proved –we were unable to establish consistency, which would be possible with a different site- removal of the flora is not an option. We didn’t receive an appropriate sheet for the riverbank biodiversity.
Chemistry: Several pH measures were used in the process of finding the pH –all showed different results, and it was difficult to determine which had the error. It was however settled on the Vernier pH sensor, since it was easy to calibrate. Due to shortage of time, the samples were not used to the extent they could have been –salinity had to be excluded. The correlation between pH levels of the river and soil could be researched further. Also, a comparison of sea and river water would have been interesting, or just looking at the pH at much longer distances, but this would not be compatible with the bio part.
The 3 best things • We used many mini-hypothesis’ when handling the data and we confirmed our main hypothesis • We looked at some of the biotic and abiotic factors linked to water • We were efficient when collecting data and we got many results, which are relevant to each other, and enough samples to draw valid conclusions.
Summarised new improved method’s • Biology: Use the Systematic sampling strategy (with a point quadrat) based on a environmental gradient, such as succession or water depth, to find the abiotic and biotic factor that influence the biodiversity by the riverbank. • Physics: Find the relationship between the velocity of the river water and the altitude and depth, using a small turbine, and consider how the biotic and abiotic factors influence this. • Chemistry: Find the pH of water samples taken from different locations of the river. using a Vernier pH sensor, and find how this is influenced by the biotic and abiotic factors. Find the amount of water within the plants, my finding the biomass( dry weight of organic matter) i.e amount of water= Organic matter- biomass.