Download
1 / 3
30 likes | 116 Views
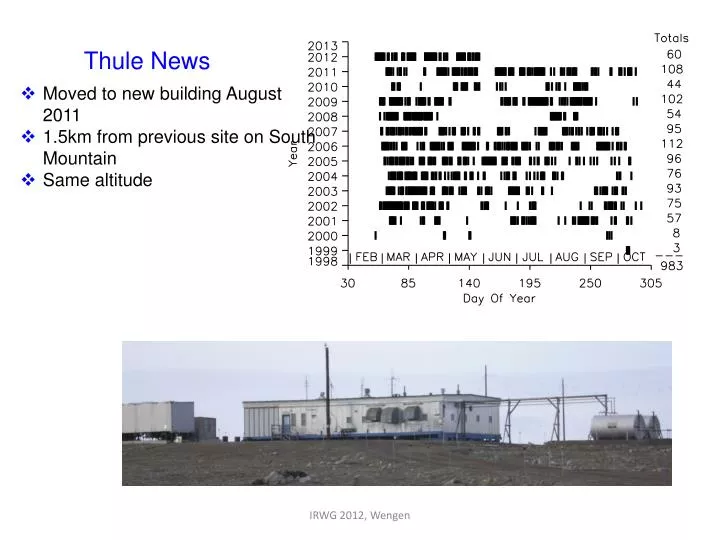
Thule News. Moved to new building August 2011 1.5km from previous site on South Mountain Same altitude. Now All Instruments are in “ NDACC ” Building UV spectro -radiometer - DMI Sun photometer - AERONET/NASA Aerosol LIDAR - U Rome Microwave Radiometer - INGV Rome

E N D
Thule News • Moved to new building August 2011 • 1.5km from previous site on South Mountain • Same altitude IRWG 2012, Wengen
Now All Instruments are in “NDACC” Building • UV spectro-radiometer - DMI • Sun photometer - AERONET/NASA • Aerosol LIDAR - U Rome • Microwave Radiometer - INGV Rome • O3 Sondes (winter) - DMI • Aerosol Sampler - U Sienna • IR Radiometer - U Sienna • Solar FTS - NCAR IRWG 2012, Wengen
O3 HF HCl Profiles of several species and temperatures showing the dramatic state of the 2011 Arctic Winter/Spring vortex and O3 loss over Thule, GR. Curve A 2000-2010 mean March outside vortex (2.5PVU @PT=440K). Curve B 2000-2010 mean March inside vortex (3.2PVU @PT=440K) and Curve C mean March 2011 (all inside). Horizontal bars are the standard deviation of observations at 3 select altitudes.. NCEP Temperature HNO3