Download
1 / 18
180 likes | 305 Views
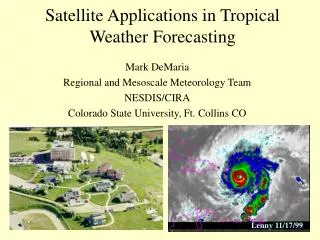
Tropical Cyclone Rapid Intensity Change Forecasting Using Lightning Data during the 2010 GOES-R Proving Ground at the National Hurricane Center. Mark DeMaria and John A. Knaff, NOAA/NESDIS, Fort Collins, CO Michael Brennan and John L. Beven , National Hurricane Center, Miami, FL

E N D
Tropical Cyclone Rapid Intensity Change Forecasting Using Lightning Data during the 2010 GOES-R Proving Ground at the National Hurricane Center Mark DeMaria and John A. Knaff, NOAA/NESDIS, Fort Collins, CO Michael Brennan and John L. Beven, National Hurricane Center, Miami, FL Nicholas Demetriades, Vaisala Inc., Tucson, AZ Robert T. DeMaria and Andrea Schumacher, CIRA/CSU Fort Collins, CO John Kaplan, NOAA/HRD, Miami, FL AMS Lightning Conference, Seattle, WA January 2011
Outline • Lightning activity and tropical cyclone intensity change • 2005-2009 study of WWLLN lightning density and rapid intensification (RI) • Experimental RI forecast algorithm for the GOES-R Proving Ground using Vaisala’s Global Lightning Dataset (GLD360) • Results from 2010 tests at NHC
Lightning and TC Intensity • Cecil and Zipser (1999) • More lightning in weaker storms • Little relationship with TC intensity change • Small OTD sample • Squires and Businger (2008) • Eyewall lightning outbreaks during rapid intensification of Rita and Katrina • Price et al. (2009) • Lightning increases related to rapid intensification • Time lag highly variable • DeMaria and DeMaria (2009) • Rainband lightning most correlated with rapid intensification • Largest inner core lightning density with sheared systems • Abarca et al. (2010) • Flash density smaller for hurricanes than non-hurricanes • More lightning for intensifying systems • Lightning distribution more symmetric for intensifying systems
Data Sample for Forecast Algorithm • Full lifecycle of all Atlantic and east Pacific tropical cyclones 2005-2009 • Over water only • Storm environmental variables from SHIPS intensity model database • SST, vertical shear, etc. • Storm centered lighting density • WWLLN data w/ annual normalization to OTD/LIS • 6 hour composites • 100 km radial intervals 0 to 600 km
2005-2009 Storm Tracks East Pacific: 1327 cases from 90 tropical cyclones Atlantic: 1154 cases from 86 tropical cyclones
Rapid Intensification (RI) • Increase in maximum winds of 30 kt or more in 24 hr • Difficult but important forecast problem • ~10th percentile of long-term climatology • Environmental factors associated with RI • Low shear, large upper-level divergence • High oceanic heat content, warm SST, high low-level RH • Cold and symmetric cloud tops (from GOES IR) • Some intensification in previous 12 hr
Lightning Density vs. Radius for RI and non-RI Cases Atlantic East Pacific Lightning density also function of vertical shear, SST, initial intensity, etc.
Experimental Forecast Algorithm:The Lightning-based Rapid Intensification Index (L-RII) • Linear discriminant analysis • Optimally weights multiple inputs to separate data sample into 2 classes • RI and non-RI cases • NHC operational RII algorithm includes 8 inputs • Add 2 lightning parameters for L-RII • Inner core density (0-100 km) • Rainband density (300-400 km) • Separate algorithms for Atlantic and East Pacific • Versions with and without lightning from same developmental sample • Provides probability of RI in the next 24 hr
The GOES-R Proving Ground • GOES-R will include 16 channel advanced baseline imager and geostationary lightning mapper (GLM) • Scheduled for late 2015 • Proving ground provides real-time demonstrations of GOES-R data and products to NWS forecasters • Run with proxy data • 6 products demonstrated at NHC • Including experimental rapid intensity algorithm • GLM proxy from Vaisala GLD360 lightning locations
Normalization of GLD360 data • Spatially dependent adjustments to GLD360 • Based on 3 month overlap of WWLLN, GLD-360 • Oct-Dec 2009 Hurricane Ida Nov., 2009
2010 Storm Tracks East Pacific: 121 cases from 12 tropical cyclones Atlantic: 291 cases from 21 tropical cyclones
RII Verification Metrics • Bias = ( Pf/Nobs ) - 1 • Brier Score = (1/Nf)[Pf – Pobs]2 • Threat Score = a/(a+b+c) from 2 by 2 contingency table • Area of overlap between forecast and observations • Find max TS for range of probability thresholds
2010 Preliminary Verification Results:Impact of Lightning Input
Qualitative Use of Lightning Time SeriesHurricane Danielle (2010) example
Qualitative Use of Lightning Time SeriesTropical Storm Fiona (2010) example
Conclusions • Large sample of lightning and large-scale data created for Atlantic and east Pacific tropical cyclones • Lightning density correlated with intensity changes, initial intensity, shear, SST and other environmental variables • Experimental rapid intensity forecast algorithm developed • Inner core and rainband lightning discriminators • Real time tests in 2010 show promise • Reduces bias in Atlantic and east Pacific • Mixed results for Brier and Threat Score
Next Steps • Repeat 2010 L-RII forecasts with WWLLN input • Verify using final NHC best tracks • Test improved RII algorithm • Additional testing in real time during 2011 hurricane season