Download
1 / 34
340 likes | 457 Views
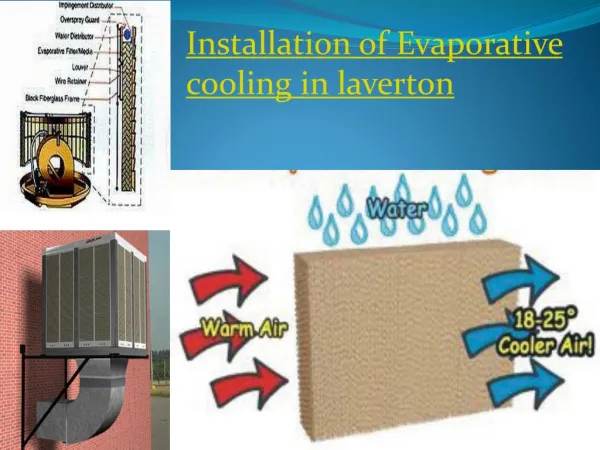
Evaporative Cooling Tests of Pixel Disk Sectors June 2000. E. Anderssen, M. Gilchriese, F. Goozen, F. McCormack, J. Taylor, T. Weber, J. Wirth Lawrence Berkeley National Laboratory W. K. Miller, W. O. Miller HYTEC, Inc. G. Hallewell Rutherford Appleton Laboratory V. Vacek

E N D
Evaporative Cooling Tests of Pixel Disk SectorsJune 2000 E. Anderssen, M. Gilchriese, F. Goozen, F. McCormack, J. Taylor, T. Weber, J. Wirth Lawrence Berkeley National Laboratory W. K. Miller, W. O. Miller HYTEC, Inc. G. Hallewell Rutherford Appleton Laboratory V. Vacek Czech Technical University of Prague
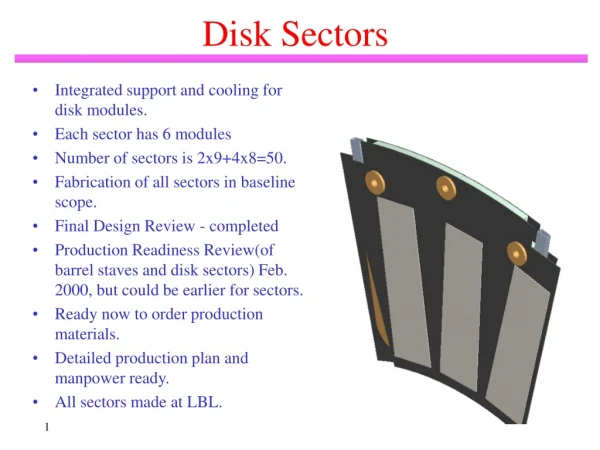
Outline • Background info on evaporative cooling • What was tested • Infrared thermography before evaporative tests • Results of evaporative tests • Aluminum-tube sectors • Sealed-tube(HYTEC) sectors • Conclusions
Evaporative Cooling Background • Will not describe evaporative cooling setup here. • Include basic charts for C3F8 for reference.
What Was Tested • Four aluminum-tube sectors. Prototypes #7 - 10. • All had about 0.43 mm thick carbon-carbon faceplates manufactured by ALLCOMP, Inc. These plates were also used for the fabrication of the second prototype support ring by HYTEC and ALLCOMP. The center “drop outs” were used to make the sectors. • The plates were impregnated with cyanate ester, which left a surface layer approximately 25 microns thick. This resin layer was removed by scrubbing on prototype #10. • Prototypes #7 and #8 have aluminum tubes that have interior dimensions of 1.69 x 4.06 mm, the smaller dimension setting the thickness of the sector. The hydraulic diameter is 2.4 mm • Prototypes #9 and #10 have tubes that are 2.74x4.19 mm. The hydraulic diameter is 3.3 mm. • The tubes for #7 and #8 were black anodized. The tubes for #9 and #10 were not - lack of time to meet test schedule. • Sealed-tube(HYTEC) sector • Prototype #4 was tested. This had 0.5 mm faceplates, a double-wall sealed carbon-carbon tube and an hydraulic diameter of 3.2 mm.
Test Setup • This shows the four aluminum-tube sectors. There are two pairs, running the pair in series. Two valves allow running each pair separately or running both pairs in parallel. • Sectors #9 and #10 were removed and replaced by the HYTEC sector during the test program.
Aluminum-tube Prototype Sectors Exhaust lines Capillary(0.030” ID 1.2 m long)
Sectors in Box in Freezer • Box with sectors put in freezer to provide ambient temperature of about -12C. • RTDs read out via “Prague system” by V. Vacek. • Pressure sensors same. • Flow not recorded by computer. • Precooling set point not recorded by computer. • Computer data recorded every 2-30 sec(typical 10 seconds but varied during test program).
IR Thermography • Infrared thermography was performed at LBNL on sectors using room temperature(20-21oC) water coolant before making measurements with the evaporative system at CERN. This was done, in part, to correlate the discrete-point measurement done at CERN with the IR measurements. The set up is shown below and the results for all sectors shown on the next pages.
Aluminum-Tube #7 Front Back
Aluminum-Tube #8 Front Back
Aluminum-Tube #9 Front Back
Aluminum-Tube #10 Front Back
HYTEC #4 Backside of HYTEC #4 was not imaged yet. Front Back
Data Recorded • Data were recorded about every 10 seconds, usually. Sometimes 2 sec or 30 seconds. • Ambient temperature in freezer at two locations • Exhaust/return pressure, which sets the exit temperature • Pressure differential across sector pair or single sector. • Inlet fluid temperature before capillary(0.030” capillary was used for all tests). • Outlet fluid temperature • Temperature at top of long vertical glass column in cooling lab. • RTD readings on sectors • Data recorded by hand in logbook • Power settings. Typically 50W per sector but sometimes more. Power always refers to power per sector. • Flow rate of fluid. • Set point for precooling
Test Program • June 16 • Sectors 7 and 8 tested • Sectors 9 and 10 tested • Sectors 7+8 and sectors 9+10 tested in parallel(one fluid inlet, two capillaries, one for each pair of sectors) • June 17 • Remove 9 and 10 and replace with HYTEC #4. Purge system. • June 18 • Day off • June 19 • HYTEC test • 7+8 on/off • 7+8 power margin • simulate 3 in series • change precool to +18
(lbl_05)Sectors 7+8 - Silicon T Only 60W 50W Flow =1.2 gm/sec Exhaust P=2.13 bar DP=0.16 bar No power
(lbl_06)Sectors 9+10 - Silicon T Only 60 Watts 50 Watts Flow 1.2 gm/sec Exhaust P=2.15-2.19 bar DP=0.09 bar No power
(lbl_07)Sectors7+8 and 9+10 in Parallel Spikes casued by hand setting of power - overshoot
(lbl_11)Sectors 7+8 at 50W - Stability Flow =1.2 gm/sec Exhaust pressure=2.09 bar absolute DP=0.155 bar
Conclusions • The current thermal requirement of keeping the silicon temperature at or below -6oC can be met comfortably at the nominal 50W maximum power running two aluminum-tube sectors in series with the smaller(2.4 mm) of the hydraulic diameters tested. There is no reason to use a larger hydraulic diameter. • The measured temperature uniformity of prototypes 7 and 8 in series at 50W is about 4oC using RTDs located at the center of the dummy heaters(lbl_11 data set) using precooled liquid. To this needs to be added about 2OC based on the IR thermography to account for spread within heater. This is well within spec. • There is considerable margin in the system if the power were to increase beyond 50W per sector, running two sectors in series(lbl_12 data set) also with precooled liquid. • Operation without precooled liquid was also demonstrated(lbl_17 data set), but appears to require somewhat higher flow, thus slightly higher pressure drop and about 5oC +2oC uniformity. The operating power margin beyond 50W appears slightly reduced compared to precooled liquid but these tests should be repeated. • Operation of the 3 al-tube sectors in series at 50W each appears feasible, and was simulated by increasing the total power on two sectors to 150W. The temperature uniformity of the silicon across all three sectors could be about 10oC, but might be worse - depends on individual sector performance and location relative to exhaust, which sets the temperature. • The HYTEC prototype #4 was operated successfully but the non-uniformity of the current design(tube location) would make it difficult to meet the current -6oC spec in all silicon locations unless the exhaust temperature is about -30oC.
Implications for Cooling Work Plan • In the case of the aluminum-tube sectors, proceed with 2.4 mm hydraulic diameter as the baseline. • For HYTEC sectors, stay with current hydraulic diameter but understand timescale for tube redesign to obtain better temperature uniformity. • For either option, plan tests for December timescale that would compare directly operation of 3 sectors in series with 2 sectors in series • These tests should be done on prototypes as close as possible to the final designs • Should include more advanced prototypes of cooling connections, again as close as possible to what would be used in the experiment. This means both local connections on sector and simulated piping to end of pixel region, and perhaps beyond. • Some improvements in instrumentation/measurements • Computer record flow, precool conditions. • Improve measurements of inlet fluid(after capillary) and exhaust fluid temperatures. • Make more systematic study of temperature, pressure, flow…so that predictive model can be made. Measurements this time were too few to do this.