Download
1 / 1
10 likes | 203 Views
Nine Mile Run Stream Assessment Emily Broich & Michael Muder University of Pittsburgh, Department of Geology and Planetary Science. Abstract

E N D
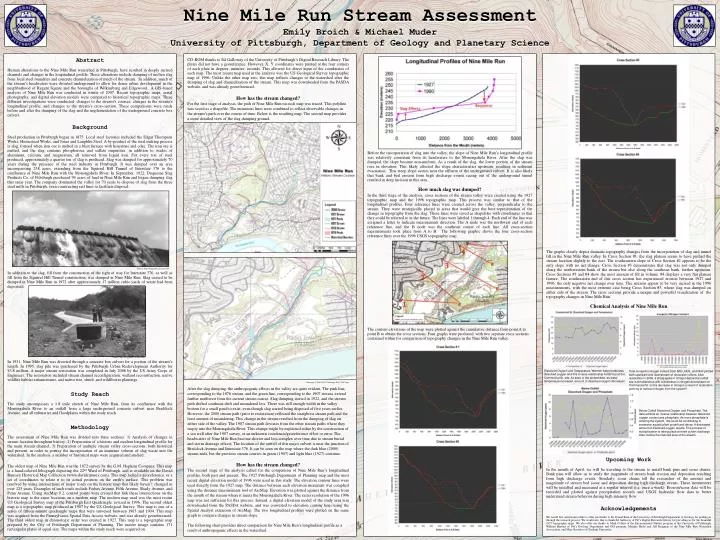
Nine Mile Run Stream AssessmentEmily Broich & Michael MuderUniversity of Pittsburgh, Department of Geology and Planetary Science Abstract Human alterations to the Nine Mile Run watershed in Pittsburgh, have resulted in deeply incised channels and changes in the longitudinal profile. These alterations include dumping of molten slag from local steel foundries and concrete channelization of much of the stream. In addition, much of the stream’s headwaters were diverted underground to allow for dense urban development in the neighborhood of Regent Square and the boroughs of Wilkinsburg and Edgewood.. A GIS-based analysis of Nine Mile Run was conducted in winter of 2007. Recent topographic maps, aerial photography, and digital elevation models were compared to historical topographic maps. Three different investigations were conducted: changes to the stream’s courses; changes in the stream’s longitudinal profile; and changes to the stream’s cross-section. These comparisons were made before and after the dumping of the slag and the implementation of the underground concrete box culvert. Background Steel production in Pittsburgh began in 1875. Local steel factories included the Edgar Thompson Works, Homestead Works, and Jones and Laughlin Steel. A by-product of the steel making process is slag, formed when iron ore is melted in a blast furnace with limestone and coke. The iron ore is melted, and the slag contains phosphorous and sulfate impurities, in addition to oxides of aluminum, calcium, and magnesium, all removed from liquid iron. For every ton of steel produced, approximately a quarter ton of slag is produced. Slag was dumped for approximately 70 years during the presence of the steel industry in Pittsburgh. It was dumped over an area encompassing 238 acres, extending from the Squirrel Hill Tunnel of Interstate 376 to the confluence of Nine Mile Run with the Monongahela River. In September, 1922, Duquesne Slag Products Co. of Pittsburgh purchased 94 acres of land in Nine Mile Run and began dumping slag that same year. The company dominated the valley for 70 years to dispose of slag from the three steel mills in Pittsburgh, even constructing rail lines to facilitate disposal. Source: http://slaggarden.cfa.cmu.edu/ In addition to the slag, fill from the construction of the right of way for Interstate 376, as well as fill from the Squirrel Hill Tunnel construction, was dumped in Nine Mile Run. Slag ceased to be dumped in Nine Mile Run in 1972 after approximately 17 million cubic yards of waste had been deposited. Source: http://slaggarden.cfa.cmu.edu/ In 1931, Nine Mile Run was diverted through a concrete box culvert for a portion of the stream’s length. In 1995, slag pile was purchased by the Pittsburgh Urban Redevelopment Authority for $3.8 million. A major stream restoration was completed in July 2006 by the US Army Corps of Engineers. The restoration included stream channel reconfiguration, wetland reconstruction, native wildlife habitat enhancement, and native tree, shrub, and wildflower plantings. Study Reach The study encompasses a 1.8 mile stretch of Nine Mile Run, from its confluence with the Monongahela River to an outfall from a large underground concrete culvert near Braddock Avenue, and all tributaries and floodplains within the study reach. Methodology The assessment of Nine Mile Run was divided into three sections: 1) Analysis of changes in stream location throughout history; 2) Preparation of a historic and modern longitudinal profile for the main stream channel; 3) Preparation of multiple stream valley cross-sections, both historical and present, in order to portray the incorporation of an immense volume of slag waste into the watershed. In the analysis, a number of historical maps were acquired and studied. The oldest map of Nine Mile Run was the 1872 survey by the G.M. Hopkins Company. This map is a hand-colored lithograph depicting the 22nd Ward of Pittsburgh, and is available on the David Rumsey Historical Map Collection (www.davidrumsey.com). This map lacked a georeference, or a set of coordinates to relate it to its actual position on the earth’s surface. This problem was resolved by using intersections of major roads on the historic map that likely haven’t changed in over 125 years. Examples of such roads include Forbes Avenue, Fifth Avenue, Shady Avenue, and Penn Avenue. Using ArcMap 9.2, control points were created that link these intersections on the historic map to the same locations on a modern map. The modern map used was the most recent US Geological Survey map of the Pittsburgh East Quadrangle, revised in 1996. The second oldest map is a topographic map produced in 1907 by the US Geological Survey. This map is one of a series of fifteen-minute quadrangle maps that were surveyed between 1903 and 1904. This map was acquired from the Pennsylvania Spatial Data Access website, and was already georeferenced. The third oldest map in chronologic order was created in 1927. This map is a topographic map prepared by the City of Pittsburgh Department of Planning. The master image contains 171 rectangular plates of equal size. The maps within the study reach were acquired on CD-ROM thanks to Ed Galloway of the University of Pittsburgh’s Digital Research Library. The plates did not have a georeference. However, X, Y coordinates were printed at the four corners of each plate in degrees, minutes, seconds. This allowed for direct input of the coordinates of each map. The most recent map used in the analysis was the US Geological Survey topographic map of 1996. Unlike the other map sets, this map reflects changes to the watershed after the dumping of slag and channelization of the stream. This map was downloaded from the PASDA website, and was already georeferenced. How has the stream changed? For the first stage of analysis, the path of Nine Mile Run on each map was traced. This polyline was saved as a shapefile. The numerous lines were combined to reflect observable changes in the stream’s path over the course of time. Below is the resulting map. The second map provides a more detailed view of the slag dumping ground. Basemap: USGS 1996 “Pittsburgh East” 24k Topo After the slag dumping, the anthropogenic effects in the valley are quite evident. The pink line, corresponding to the 1876 stream, and the green line, corresponding to the 1907 stream, extend further northwest from the current stream course. Slag dumping started in 1922, and the stream path shifted southeast shift and meandered less. There was still enough width in the valley bottom for a small pond to exist, even though slag started being disposed of five years earlier. However, the 2000 stream path (prior to restoration) reflected the straightest stream path and the least amount of meandering. This change in the stream resulted from the dumping of slag on either side of the valley. The 1907 stream path deviates from the other stream paths where they empty into the Monongahela River. This change might be explained either by the construction of a sea wall after the 1907 survey, or an unknown coordinate/georeference offset or error. The headwaters of Nine Mile Run become shorter and less complex over time due to stream burial and storm drainage effects. The location of the outfall of this major culvert is near the junction of Braddock Avenue and Interstate 376. It can be seen on the map where the dark blue (2000) stream ends, but the previous stream courses in green (1907) and light blue (1927) continue. How has the stream changed? The second stage of the analysis called for the comparison of Nine Mile Run’s longitudinal profiles, both past and present. The 1927 Pittsburgh Department of Planning map and the most recent digital elevation model of 1996 were used in this study. The elevation contour lines were used directly from the 1927 map. The distance between each elevation increment was complied using the distance measurement tool of ArcMap. Elevation was plotted against the distance from the mouth of the stream where it meets the Monongahela River. The raster resolution of the 1996 map was not sufficient for this process. Instead, a digital elevation model of the study area was downloaded from the PASDA website, and was converted to elevation contour lines using the Spatial Analyst extension of ArcMap. The two longitudinal profiles were plotted on the same graph to compare changes in stream slope. The following chart provides direct comparison for Nine Mile Run’s longitudinal profile as a result of anthropogenic effects in the watershed. Before the incorporation of slag into the valley, the slope of Nine Mile Run’s longitudinal profile was relatively consistent from its headwaters to the Monongahela River. After the slag was dumped, the slope became non-uniform. As a result of the slag, the lower portion of the stream rose in elevation. This likely affected the slope characteristics upstream, resulting in sediment evacuation.. This steep slope occurs near the effluent of the underground culvert. It is also likely that bank and bed erosion from high discharge events racing out of the underground tunnel resulted in deep incision in this area. How much slag was dumped? In the third stage of the analysis, cross sections of the stream valley were created using the 1927 topographic map and the 1996 topographic map. This process was similar to that of the longitudinal profiles. Four reference lines were created across the valley, perpendicular to the stream. They were strategically placed in areas that would give the best representation of the change in topography from the slag. These lines were saved as shapefiles with coordinates so that they could be referred to in the future. The lines were labeled 1 through 4. Each end of the line was assigned a letter to indicate measurement direction. The A node was the northwest end of each reference line, and the B node was the southeast corner of each line. All cross-section measurements took place from A to B. The following graphic shows the four cross-section reference lines over the 1996 USGS topographic map. The contour elevations of the map were plotted against the cumulative distance from point A to point B to obtain the cross sections. Four graphs were produced, with two separate cross sections contained within for comparison of topography changes in the Nine Mile Run valley. The graphs clearly depict dramatic topography changes from the incorporation of slag and tunnel fill in the Nine Mile Run valley. In Cross Section #1, the slag plateau seems to have pushed the stream location slightly to the east. The southeastern slope of Cross Section #2 appears to be the only slope with no net change. Cross Section #3 demonstrates that slag was not only dumped along the northwestern bank of the stream but also along the southeast bank, further upstream. Cross Sections #3 and #4 show the most amount of fill in volume. #4 displays a very flat plateau feature. The southeastern end of this cross section has experienced erosion between 1927 and 1996, the only negative net change over time. The streams appear to be very incised in the 1996 measurements, with the most extreme case being Cross Section #3, where slag was dumped on either side of the stream. The cross sections provide a unique and powerful visualization of the topography changes in Nine Mile Run. Chemical Analysis of Nine Mile Run Upcoming Work In the month of April, we will be traveling to the stream to install bank pins and scour chains. Bank pins will allow us to study the magnitude of stream bank erosion and deposition resulting from high discharge events. Similarly, scour chains tell the researcher of the amount and magnitude of stream bed scour and deposition during high discharge events. These instruments will be installed and measured at a regular interval (i.e. once a week). Erosion/scour data will be recorded and plotted against precipitation records and USGS hydraulic flow data to better understand stream behavior during high intensity flow. Acknowledgements We would first and foremost like to offer our thanks to Dr. Daniel Bain of the University of Pittsburgh Department of Geology for guiding us through the research process. We would also like to thank Ed Galloway of Pitt’s Digital Research Library for providing us for the beautiful 1927 topographic maps. We also offer our thanks to Mark Collins of the Environmental Studies program at the University of Pittsburgh, William Harbert of Pitt’s Geology Department and GIS program, Marijke Hecht and Jeff Bergman of the Nine Mile Run Watershed Association, and Mary Kostalos of Chatham University. Nine Mile Run Stream AssessmentEmily Broich & Michael MuderUniversity of Pittsburgh, Department of Geology and Planetary Science Dissolved Oxygen and Temperature. Warmer water holds less dissolved oxygen and this inverse relationship holds true at the Commercial St. site. As seen in the plotted data, as water temperature increases, amount of dissolved oxygen decreases. Total inorganic nitrogen content from NO3, NO2, and NH3 plotted both upstream and downstream of restoration efforts. After restoration in 2005, a sharp spike in nitrogen below the outfall site is simultaneous with a decrease in nitrogen downstream at Commercial St. Is this decrease in nitrogen a result of restoration working to remove nitrogen from the system? Below Outfall Dissolved Oxygen and Phosphate. The data exhibits an inverse relationship between dissolved oxygen content and phosphate. As more phosphate is entering the system, this could be contributing to excessive aquatic plant growth and decay. A decreased amount of dissolved oxygen results. This process of eutrophication is taking place at three culvert discharge sites, before the restored area of the stream.