Download

1 / 16
160 likes | 337 Views
Landuse. Fairfax County, Virginia Watershed Management Plans. Scope of task. Develop countywide land use/ land cover GIS data layers useful for plan development Watershed characterization (i.e. maps, data analysis) Pollution & Hydrologic modeling Key requirements:

E N D
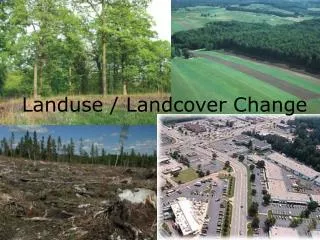
Landuse Fairfax County, Virginia Watershed Management Plans
Scope of task • Develop countywide land use/ land cover GIS data layers useful for plan development • Watershed characterization (i.e. maps, data analysis) • Pollution & Hydrologic modeling • Key requirements: • A layer containing a land use mix for both existing and future conditions • Key parameter for modeling water quality • A layer containing Impervious values (connected & disconnected) for both conditions • Key parameter for modeling water quantity
Available digital data • Tax Administration real estate records • Each record contained a unique code for each parcel: • Existing land use • Zoned land use • Adopted land use comprehensive plan • Polygons containing planned land use information • Twenty-two different planned land use categories • Parcel data • Polygons contained a unique ID for each parcel • Included vacant & underutilized parcels • Planimetric data (1997 aerial photography) Codes > 200 types
Consolidation • The need to simplify (i.e. group) land use types through consolidation was evident • 200 different codes (included embedded towns) • Code numbering convention facilitated consolidation
Consolidation Residential: • ESR - Estate > 2 acres/residence • LDR - Low Density ½ - 2 acres/residence • MDR - Medium Density < ½ acre/residence < 8 dwellings/acre • HDR - High Density < acre/residence Commercial: • LIC - Low Intensity • HIC - High Intensity • Grouped existing, zoned & planned land use types into 11 categories: Miscellaneous: • OS - Open Space • GC - Golf Course • INT - Institutional: • Government/Universities • IND - Industrial • Airports • Railways Transportation: • TRANS - Road rights-of-way
Creating landuse layer - a GIS exercise Existing conditions: • Each real estate record was assigned a category for existing, zoned & planned land use • Joined the tabular tax record data to the parcel layer polygons • Included category: TRANS landuse • Areas outside of the parcel boundaries = ROW • Included category: WATER land cover • Planimetric data of the stream network, lakes
Creating landuse layer - a GIS exercise Future conditions: • Intersected comprehensive plan coverage with the parcel layer • Most parcels were already built-out • Vacant & underutilized parcels • Compared zoned vs. planned land use • Where different, chose classification that yielded the greatest density
Creating landuse layer - a GIS exercise Existing conditions - Tysons Corner
Creating landuse layer - a GIS exercise Future conditions - Tysons Corner future
Estimating imperviousness values • Used planimetric data • Features were assigned a corresponding % imperviousness • Buildings, roads, parking lots & sidewalks/trails – 100% • Parking lots, unpaved – 50% • Areas outside planimetric features – 0% • Feature types sampled to estimate the typical DCIA/NDCIA split • Roads, parking lots – 100% DCIA • Sidewalks/trails – 85% DCIA, 15% NDCIA • Buildings – DCIA varied by type • Commercial - 100% • Industrial - 95% • Multi-Family Residential - 90% • Single Family Residential - 50%
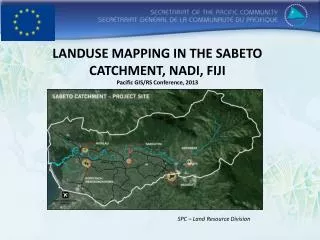
Estimating imperviousness values Planimetrics - Tysons Corner
Estimating imperviousness values • Estimating exist & future condition imperviousness values by land use: • Sampled planimetric data in areas representative for each land use category • Average % imperviousness was calculated for each land use category • Assigned % DCIA/NDCIA to each category based on appropriate feature types • DCIA & NDCIA values were aggregated to a “subbasin” level • Polygons were created for modeling purposes • Typically 300-500 acres in size • Over 1800 polygons
Estimating imperviousness values Existing % Imperv by Land use - Tysons Corner
Estimating imperviousness values Future % Imperv by Land use - Tysons Corner
Conclusion/Challenges • The LU/LC methodology Fairfax County implemented for its watershed planning effort worked well at the local scale & could be a method used to help standardize urbanized LU/LC categories across the bay watershed. • Many smaller jurisdictions have less readily available data, however; many larger urban areas maintain data similar to Fairfax (i.e. comp plan, tax/parcel information & planimetrics) which could be used with this methodology.


![❤[READ]❤ Zoned in the USA: The Origins and Implications of American Land-Use Regulation](https://cdn7.slideserve.com/13194520/slide1-dt.jpg)