Download
1 / 1
10 likes | 129 Views
On Combining Landsat Imagery and Radar Altimetry To Estimate Reservoirs Water Volume: Case-Study of Lake Nasser (Egypt) Ron Abileah (1), Stefano Vignudelli (2), and Andrea Scozzari (3) jOmegak, San Carlos CA, USA, (Abileah@jOmegak.com)

E N D
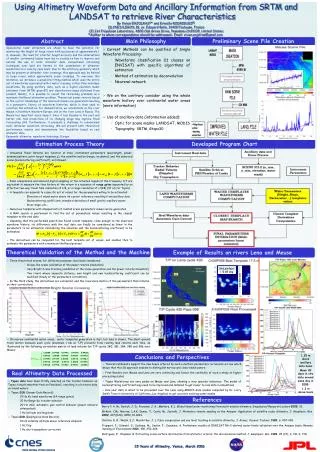
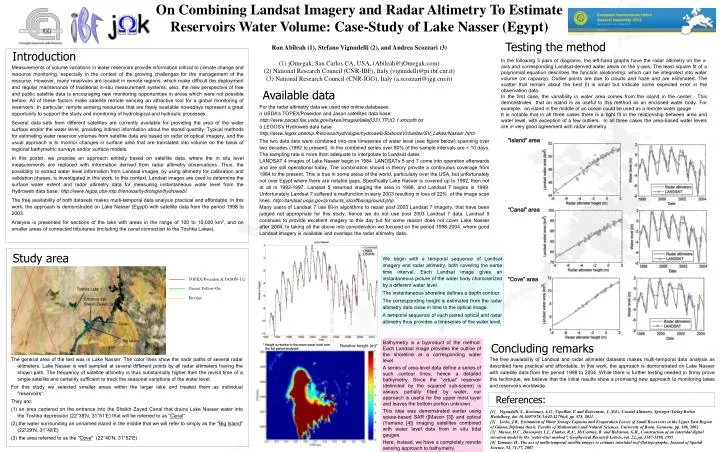
On Combining Landsat Imagery and Radar Altimetry To Estimate • Reservoirs Water Volume: Case-Study of Lake Nasser (Egypt) • Ron Abileah (1), Stefano Vignudelli (2), and Andrea Scozzari (3) • jOmegak, San Carlos CA, USA, (Abileah@jOmegak.com) • National Research Council (CNR-IBF), Italy (vignudelli@pi.ibf.cnr.it) • National Research Council (CNR-IGG), Italy (a.scozzari@igg.cnr.it) Testing the method Introduction In the following 3 pairs of diagrams, the left-hand graphs have the radar altimetry on the x-axis and corresponding Landsat-derived water areas on the y-axis. The least square fit of a polynomial equation describes the function relationship, which can be integrated into water volume (or capacity). Outlier points are due to clouds and haze and are eliminated. The scatter that remain about the best fit is small but indicate some expected error in the observation data. In the first case, the variability in water area comes from the island in the center. This demonstrates that an island is as useful to this method as an enclosed water body. For example, an island in the middle of an ocean could be used as a remote water gauge It is notable that in all three cases there is a tight fit in the relationship between area and water level, with exception of a few outliers. In all three cases the area-based water levels are in very good agreement with radar altimetry. Measurements of volume variations in water reservoirs provide information critical to climate change and resource monitoring, especially in the context of the growing challenges for the management of the resource. However, many reservoirs are located in remote regions, which make difficult the deployment and regular maintenance of traditional in-situ measurement systems; also, the new perspective of free and public satellite data is encouraging new monitoring opportunities in areas which were not possible before. All of these factors make satellite remote sensing an attractive tool for a global monitoring of reservoirs. In particular, remote sensing resources that are freely available nowadays represent a great opportunity to support the study and monitoring of hydrological and hydraulic processes. Several data sets from different satellites are currently available for providing the area of the water surface and/or the water level, providing indirect information about the stored quantity. Typical methods for estimating water reservoir volumes from satellite data are based on radar or optical imagery, and the usual approach is to monitor changes in surface area that are translated into volume on the basis of regional bathymetric surveys and/or surface models. In this poster, we propose an approach entirely based on satellite data, where the in situ level measurements are replaced with information derived from radar altimetry observations. Thus, the possibility to extract water level information from Landsat images, by using altimetry for calibration and validation phases, is investigated in this work. In this context, Landsat images are used to determine the surface water extent and radar altimetry data for measuring instantaneous water level from the Hydroweb data base: http://www.legos.obs-mip.fr/en/soa/hydrologie/hydroweb/. The free availability of both datasets makes multi-temporal data analysis practical and affordable. In this work, the approach is demonstrated on Lake Nasser (Egypt) with satellite data from the period 1998 to 2003. Analysis is presented for sections of the lake with areas in the range of 100 to 10,000 km2, and on smaller areas of connected tributaries (including the canal connection to the Toshka Lakes). Available data • For the radar altimetry data we used two online databases: • USDA's TOPEX/Poseidon and Jason satellites data base: • http://www.pecad.fas.usda.gov/lakes/images/lake0331.TPJO.1.smooth.txt • LEGOS's Hydroweb data base: • http://www.legos.obsmip.fr/en/soa/hydrologie/hydroweb/StationsVirtuelles/SV_Lakes/Nasser.html • The two data sets were combined into one timeseries of water level (see figure below) spanning over two decades (1992 to present). In the combined series over 80% of the sample intervals are < 10 days. The sampling rate is more than adequate to interpolate to Landsat dates. • LANDSAT 4 images of Lake Nasser begin in 1984. LANDSATs 5 and 7 come into operation afterwards and are still operational today. The combination should in theory provide a continuous coverage from 1984 to the present. This is true in some areas of the world, particularly over the USA, but unfortunately not over Egypt where there are notable gaps. Specifically Lake Nasser is covered up to 1992, then not at all in 1992-1997. Landsat 5 resumed imaging the area in 1998, and Landsat 7 begins in 1999. Unfortunately Landsat 7 suffered a malfunction in early 2003 resulting in loss of 22% of the image scan lines: http://landsat.usgs.gov/products_slcoffbackground.php • Many users of Landsat 7 use fill-in algorithms to repair post 2003 Landsat 7 imagery, that have been judged not appropriate for this study, hence we do not use post 2003 Landsat 7 data. Landsat 5 continues to provide excellent imagery to this day but for some reason does not cover Lake Nasser after 2004. In taking all the above into consideration we focused on the period 1998-2004, where good Landsat imagery is available and overlaps the radar altimetry data. “Island” area “Canal” area Study area USDA LEGOS We begin with a temporal sequence of Landsat imagery and radar altimetry, both covering the same time interval. Each Landsat image gives an instantaneous picture of the water body characterized by a different water level. The instantaneous shoreline defines a depth contour. The corresponding height is estimated from the radar altimetry data close in time to the optical image. A temporal sequence of such paired optical and radar altimetry thus provides a timeseries of the water level. “Cove” area TOPEX/Poseidon & JASON-1/2 Geosat Follow-On Envisat Concluding remarks Bathymetry is a byproduct of the method. Each Landsat image provides the outline of the shoreline at a corresponding water level. A series of area-level data define a series of such contour lines, hence a detailed bathymetry. Since the “virtual” reservoir (delimited by the squared sub-scene) is always partially filled by water, our approach is useful for the upper most layer and leaves the bottom portion unknown. This idea was demonstrated earlier using space-based SAR ([Mason [3]) and optical (Yamano [4]) imaging satellites combined with water level data from in situ tidal gauges. Here, instead, we have a completely remote sensing approach to bathymetry. * Height is relative to the mean water level over the full period analysed Relative height (m)* The freeavailability of Landsat and radar altimeter datasets makes multi-temporal data analysis as described here practical and affordable. In this work, the approach is demonstrated on Lake Nasser with satellite data from the period 1998 to 2004. While there is further testing needed to firmly prove this technique, we believe that the initial results show a promising new approach to monitoring lakes and reservoirs worldwide. • The general area of the test was in Lake Nasser. The color lines show the nadir paths of several radar altimeters. Lake Nasser is well sampled at several different points by all radar altimeters having the shown path. The frequency of satellite altimetry is thus substantially higher then the revisit time of a single satellite and certainly sufficient to track the seasonal variations of the water level. • For this study we selected smaller areas within the larger lake and treated them as individual "reservoirs“. • They are: • an area centered on the entrance into the Sheikh Zayed Canal that drains Lake Nasser water into the Toshka depression (22°38'N, 31°51'E) that will be referred to as “Canal” • (2) the water surrounding an unnamed island in the middle that we will refer to simply as the "Big Island" (22°29'N, 31°48'E) • (3) the area referred to as the "Cove" (22°40'N, 31°52'E) References: [1] Vignudelli, S., Kostianoy, A.G., Cipollini, P. and Benveniste, J. (Ed.), Coastal Altimetry, Springer-Verlag Berlin Heidelberg, doi:10.1007/978-3-642-12796-0, pp. 578, 2011. [2] Liebe, J.R., Estimation of Water Storage Capacity and Evaporation Losses of Small Reservoirs in the Upper East Region of Ghana, Diploma thesis, Faculty of Mathematics and Natural Sciences, University of Bonn, Germany, pp. 106, 2002. [3] Mason, D.C., Davenport, I.J., Flather, R.A., McCartney, B. and Robinson, G.R., Construction of an intertidal digital elevation model by the 'water-line' method”, Geophysical Research Letters, vol. 22, pp. 3187-3190, 1995. [4] Yamano, H., The use of multi-temporal satellite images to estimate intertidal reef-flat topography, Journal of Spatial Science, 52, 71-77, 2007.