Download
1 / 1
10 likes | 192 Views
Improved GOES Utilization for Tropical Cyclone Forecasting. Improved GOES Utilization for Tropical Cyclone Forecasting Mark DeMaria and John A. Knaff NOAA/NESDIS/StAR/RAMMB, Fort Collins, CO Andrea B. Schumacher CIRA/Colorado State University, Fort Collins, CO

E N D
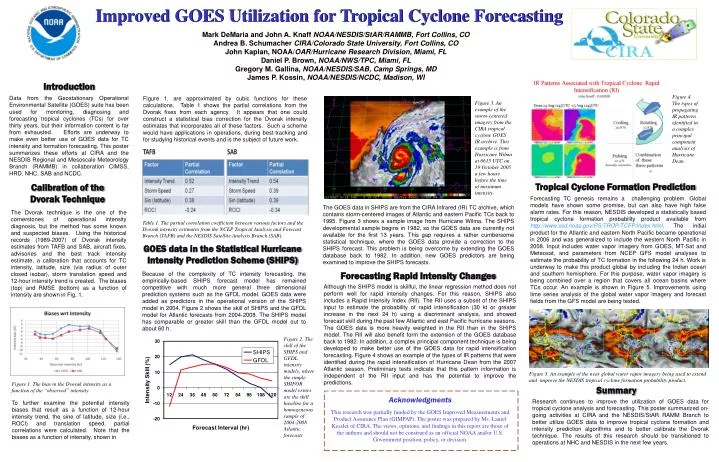
Improved GOES Utilization for Tropical Cyclone Forecasting Improved GOES Utilization for Tropical Cyclone Forecasting Mark DeMaria and John A. Knaff NOAA/NESDIS/StAR/RAMMB, Fort Collins, CO Andrea B. Schumacher CIRA/Colorado State University, Fort Collins, CO John Kaplan, NOAA/OAR/Hurricane Research Division, Miami, FL Daniel P. Brown, NOAA/NWS/TPC, Miami, FL Gregory M. Gallina, NOAA/NESDIS/SAB, Camp Springs, MD James P. Kossin, NOAA/NESDIS/NCDC, Madison, WI Introduction Figure 4. The types of propagating IR patterns identified in a complex principal component analysis of Hurricane Dean. Data from the Geostationary Operational Environmental Satellite (GOES) suite has been used for monitoring, diagnosing and forecasting tropical cyclones (TCs) for over thirty years, but their information content is far from exhausted. Efforts are underway to make even better use of GOES data for TC intensity and formation forecasting. This poster summarizes these efforts at CIRA and the NESDIS Regional and Mesoscale Meteorology Branch (RAMMB) in collaboration CIMSS, HRD, NHC, SAB and NCDC. Figure 1, are approximated by cubic functions for these calculations. Table 1 shows the partial correlations from the Dvorak fixes from each agency. It appears that one could construct a statistical bias correction for the Dvorak intensity estimates that incorporates all of these factors. Such a scheme would have applications in operations, during best-tracking and for studying historical events and is the subject of future work. Figure 3. An example of the storm-centered imagery from the CIRA tropical cyclone GOES IR archive. This example is from Hurricane Wilma at 0615 UTC on 19 October 2005 a few hours before the time of maximum intensity. Tropical Cyclone Formation Prediction Calibration of the Dvorak Technique Forecasting TC genesis remains a challenging problem. Global models have shown some promise, but can also have high false alarm rates. For this reason, NESDIS developed a statistically based tropical cyclone formation probability product available from http://www.ssd.noaa.gov/PS/TROP/TCFP/index.html. The initial product for the Atlantic and eastern North Pacific became operational in 2006 and was generalized to include the western North Pacific in 2008. Input includes water vapor imagery from GOES, MT-Sat and Meteosat, and parameters from NCEP GFS model analyses to estimate the probability of TC formation in the following 24 h. Work is underway to make this product global by including the Indian ocean and southern hemisphere. For this purpose, water vapor imagery is being combined over a region that covers all ocean basins where TCs occur. An example is shown in Figure 5. Improvements using time series analysis of the global water vapor imagery and forecast fields from the GFS model are being tested. The GOES data in SHIPS are from the CIRA Infrared (IR) TC archive, which contains storm-centered images of Atlantic and eastern Pacific TCs back to 1995. Figure 3 shows a sample image from Hurricane Wilma. The SHIPS developmental sample begins in 1982, so the GOES data are currently not available for the first 13 years. This gap requires a rather cumbersome statistical technique, where the GOES data provide a correction to the SHIPS forecast. This problem is being overcome by extending the GOES database back to 1982. In addition, new GOES predictors are being examined to improve the SHIPS forecasts. The Dvorak technique is the one of the cornerstones of operational intensity diagnosis, but the method has some known and suspected biases. Using the historical records (1989-2007) of Dvorak intensity estimates from TAFB and SAB, aircraft fixes, advisories and the best track intensity estimate, a calibration that accounts for TC intensity, latitude, size (via radius of outer closed isobar), storm translation speed and 12-hour intensity trend is created. The biases (top) and RMSE (bottom) as a function of intensity are shown in Fig. 1. Table 1. The partial correlation coefficient between various factors and the Dvorak intensity estimates from the NCEP Tropical Analysis and Forecast Branch (TAFB) and the NESDIS Satellite Analysis Branch (SAB). GOES data in the Statistical Hurricane Intensity Prediction Scheme (SHIPS) Forecasting Rapid Intensity Changes Because of the complexity of TC intensity forecasting, the empirically-based SHIPS forecast model has remained competitive with much more general three dimensional prediction systems such as the GFDL model. GOES data were added as predictors in the operational version of the SHIPS model in 2004. Figure 2 shows the skill of SHIPS and the GFDL model for Atlantic forecasts from 2004-2008. The SHIPS model has comparable or greater skill than the GFDL model out to about 60 h. Although the SHIPS model is skillful, the linear regression method does not perform well for rapid intensity changes. For this reason, SHIPS also includes a Rapid Intensity Index (RII). The RII uses a subset of the SHIPS input to estimate the probability of rapid intensification (30 kt or greater increase in the next 24 h) using a discriminant analysis, and showed forecast skill during the past few Atlantic and east Pacific hurricane seasons. The GOES data is more heavily weighted in the RII than in the SHIPS model. The RII will also benefit form the extension of the GOES database back to 1982. In addition, a complex principal component technique is being developed to make better use of the GOES data for rapid intensification forecasting. Figure 4 shows an example of the types of IR patterns that were identified during the rapid intensification of Hurricane Dean from the 2007 Atlantic season. Preliminary tests indicate that this pattern information is independent of the RII input and has the potential to improve the predictions. Figure 2. The skill of the SHIPS and GFDL intensity models, where the simple SHIFOR model errors are the skill baseline for a homogeneous sample of 2004-2008 Atlantic forecasts Figure 5. An example of the near global water vapor imagery being used to extend and improve the NESDIS tropical cyclone formation probability product. Figure 1. The bias in the Dvorak intensity as a function of the “observed” intensity Summary Acknowledgments This research was partially funded by the GOES Improved Measurements and Product Assurance Plan (GIMPAP). The poster was prepared by Ms. Laurel Kessler of CIRA. The views, opinions, and findings in this report are those of the authors and should not be construed as an official NOAA and/or U.S. Government position, policy, or decision. Research continues to improve the utilization of GOES data for tropical cyclone analysis and forecasting. This poster summarized on-going activities at CIRA and the NESDIS/StAR RAMM Branch to better utilize GOES data to improve tropical cyclone formation and intensity prediction algorithms and to better calibrate the Dvorak technique. The results of this research should be transitioned to operations at NHC and NESDIS in the next few years. To further examine the potential intensity biases that result as a function of 12-hour intensity trend, the sine of latitude, size (i.e., ROCI) and translation speed, partial correlations were calculated. Note that the biases as a function of intensity, shown in