Download
1 / 19
190 likes | 195 Views
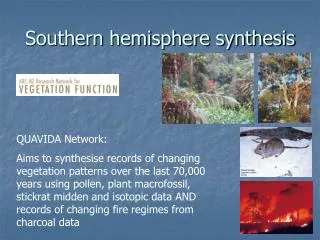
Land cover map of southern hemisphere Africa using SPOT-4 VEGETATION data. Ana Cabral 1 , Maria J.P. de Vasconcelos 1,2 , José M.C.Pereira 1,2 , Étienne Bartholomé 3 and Philippe Mayaux 3 1 Centro de Cartografia, Instituto de Investigação Científica Tropical, Portugal

E N D
Land cover map of southern hemisphere Africa using SPOT-4 VEGETATION data Ana Cabral1, Maria J.P. de Vasconcelos1,2, José M.C.Pereira1,2, Étienne Bartholomé3 and Philippe Mayaux3 1Centro de Cartografia, Instituto de Investigação Científica Tropical, Portugal 2Centro de Estudos Florestais, ISA, Portugal 3Institute for Environment and Sustainability, Joint Research Center, EC
Framework and objective • The main task is to produce a 1 km spatial resolution land cover map of southern hemisphere Africa. • Our strategy is to work with twelve monthly composite images derived from S1 data • Land cover map legend follows the FAO/ LCCS
Methods • Spectral land cover caracterization using 12 monthly composited dataset and an ISODATA unsupervised classifier.
Unsupervised classification • The ISODATA unsupervised classification was based on the 36 composited channels, using forty classes. The 40 spectral classes identified were used to guide in the selection of the training areas for land cover map legend. Unsupervised classification map produced from the twelve monthly composite data
Methods • Spectral land cover caracterization using 12 monthly composited dataset and an ISODATA unsupervised classifier. • Use of the obtained land cover map classification along with Landsat images and ancillary maps to guide the selection of training areas for classes of the legend categories defined with LCCS.
Ancillary maps • The selection of the training areas was also based in the White vegetation map (White, 1983), other land cover maps, Landsat images and fitogeographic data.
Methods • Determine spectral classes obtainable with the 12 month data set. An ISODATA classification was done with 40 classes. • Use of the obtained land cover map classification along with Landsat images and ancillary maps to guide the selection of training areas for classes of the legend categories defined with LCCS. • Spectral values were extracted from the training areas, and used in a classification tree algorithm (CART) (Breiman et al, 1984). The parameters used were: • Priors were set equal. • Twoing index criterion • Number of observations in terminal nodes were equal to 30. • Linear combinations between variables were allowed. • 10-fold cross validation. • The rules generated in the classification tree were used to build the land cover map.
Methods • Evaluate the labeling of land cover classes, comparing the land cover map with the training areas. • Filter the training dataset (Brodley, C., 1999), removing the wrong label pixels, and fitting to data a new classification tree. • The new classification tree was applied to filtered data in order to produce the final land cover map.
Results - Land cover maps, before and after the filtering (after filtering) (Before filtering)
Results – visual interpretation (Before filtering) (After filtering) (Land cover map)
Results – visual interpretation (Before filtering) (After filtering) (Land cover map) (Landsat image)
Results – visual interpretation (Before filtering) (After filtering) (Fitogeographic map) Grassland TreeSavanna Shrubsavanna Forest – Dry evergreen Woodland Woodland
Results – visual interpretation (Before filtering) (After filtering) (Land cover map)
Results – visual interpretation (Before filtering) (After filtering) (Landsat image)
Results – visual errors detection (Before filtering) (After filtering) (Spot – 4 Vegetation image) (R-G-B,Mir-IR-R)
Discussion • Labeling error can occur for several reasons including subjectivity, data entry error or inadequacy of the information used to label each training area. • Improving the quality of training data by identifying and eliminating mislabeled pixels prior to applying the classification tree algorithm increase classification accuracy, and improve the quality of training data. • Removing mislabeled pixels from the training data resulted in a higher predictive accuracy relative to classification accuracies achieved without “cleaning” the training data. • Visual interpretation shows that after the filtering process the land cover map has improved. However, some visual errors were detected, mainly in agriculture class.
Current status and future development • Trying to improve the land cover map will be done with an emsemble of trees for voting, where the final map is obtained through a majority voting scheme: • Randomly select 10 mutually exclusive testing sets with 10% of the training data each. • Produce 10 classification trees (using 10-fold crossvalidation) with the remaining 90% of data. • Classify each of the 10 test sets (which correspond to the total initial data set) with the 10 • classification trees and select records by majority voting. • Build the final land cover map with the class most voted. • Validation – The accuracy assessment will be derived from a confusion matrix, that will show a simple cross-tabulation of the mapped class label against the reference data. Data for accuracy assessment will be collected using a systematic sampling scheme. Validation data is not independent since it was also used to collect trianing data.