Download
1 / 19
190 likes | 309 Views
Improvements in Statistical Tropical Cyclone Forecast Models: A Year 2 Joint Hurricane Testbed Project Update. Mark DeMaria 1 , Andrea Schumacher 2 , John A. Knaff 1 and Renate Brummer 2 1 NOAA/NESDIS, Fort Collins, CO 2 CIRA, Colorado State University, Fort Collins, CO

E N D
Improvements in Statistical Tropical Cyclone Forecast Models: A Year 2 Joint Hurricane Testbed Project Update Mark DeMaria1, Andrea Schumacher2, John A. Knaff1 and Renate Brummer2 1NOAA/NESDIS, Fort Collins, CO 2CIRA, Colorado State University, Fort Collins, CO NHC POCs: Lixion Avila, Robbie Berg, Chris Landsea Interdepartmental Hurricane Conference March 2013
Outline • Project Tasks • Extended range baseline models for track and intensity • Update of SHIPS/LGEM databases using new NCEP Climate Re-analysis • Extending LGEM to 7 days • SHIPS/LGEM specific for the Gulf of Mexico • Progress so far • Plans for 2013 season
1. New Baseline Forecast Models • CLIPER and SHIFOR used as baseline for measuring track and intensity forecast skill • Errors provide estimate of forecast difficulty • Input to linear regression equations • t = 0 h max wind, lat, lon, motion vector • t =-12h max wind, lat, lon, motion vector • Julian Day • Output • 5-day forecast of lat, lon, max wind • Decay-SHIFOR modifies intensity over land using CLIPER track and climatological decay rate
Trajectory Approach for Baseline Models (T-CLIPER) dx/dt= u dy/dt = v (1) • Estimate u,v from climatological motion vector fields • Modify u,v at early times using t=0 motion vector • Integrate (1) to desired time • Similar approach for intensity using LGEM prediction equation with climatological input and T-CLIPER track • Can be run to any forecast time until storm leaves model domain
T-CLIPER Tests • Run in real time for most of 2012 season • Re-runs for 2003-2011 using CARQ input • Evaluation questions • How do average errors compare with OCD5 to 5 days? • Are annual average T-CLIPER errors correlated with NHC OFCL forecast errors? • What is the error behavior beyond 5 days?
Comparison of T-CLIPER and OCD5 10-year Average Errors
Correlation of Annual OCD5 and T-CLIPER Errors with OFCL • Correlate OCD5 and OFCL annual errors for 10 year sample • Repeat for T-CLIPER and OFCL • Plot r2 versus forecast interval • Plot r2 as negative if r is negative
10-Year Average T-CLIPER Errors TrackIntensity
2. New Climate Reanalysis Fields • New NCEP CFSR reanalysis fields obtained for 1979-2009 • 0.5olat/longrib files • Current SHIPS database • 1982-1999 Old NCEP reanalysis (2.5o) • 2000-2011 Operational GFS analyses (2o) • Inconsistency of RH and GFS vortex parameters • Old reanalysis not used in RII • Incomplete operational analyses used for 1989-1999 • 2000-2009 – New, Old reanalysis and Operational analyses all available
Comparison of SHIPS Predictors for Different Analyses(2000-2009 Atlantic Sample) RHLO = 850-700 hPa RH r=200 to 800 km RHMD = 700-500 hPa RH r=200 to 800 km GFS Vortex = 850 hPa tangential wind, r= 0 to 600 km
New SHIPS Database • 1979-2009: New NCEP reanalysis (1o) • 2010-2012: Operational GFS analysis (1o) • 2013 SHIPS, LGEM and RII will all use the same database
3. Seven-Day LGEM • Small sample size beyond 5 days makes fitting difficult • Use new formulation of LGEM that fits entire forecast at once 2003-2012 Sample
Comparison of Fitting Methods • LGEM Equation: dV/dt = V – β(V/Vmpi)nV β, n, Vmpi known or specified, need to find • Old fitting method • Solve for : = (1/V)dV/dt + β(V/Vmpi)nV • Calculate from best track • Fit best track to predictors using least squares at each forecast period (6, 12 …, 168 h) • New fitting method • Define “cost” function E = ½ (Vfcst-Vobs)dt • Find single set of coefficients to minimize E • Requires adjoint of LGEM equation for fitting
Features of 7-Day LGEM • Adjoint minimization instead of least squares fit to • Need to reduce predictor set for efficiency • Replace simple empirical MPI function with theoretical Bister and Emanuel (2003) formula • Can incorporate SST cooling and entrainment in MPI formula • Include persistence and GOES data through modification of at early times • Similar to T-CLIPER approach
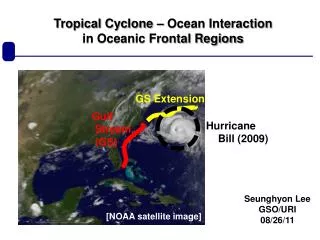
4. Gulf of Mexico LGEM • Rappaport et al. (2010) showed Gulf storms have consistent behavior • Gulf-specific SHIPS/LGEM may improve skill • Gulf sample size very small, especially beyond 72 h • Use same formulation as 7-Day LGEM • Add new Gulf cases from 1979-1980
Plans for 2013 Hurricane Season • Run standard 5-day SHIPS/LGEM • Run parallel 7-day LGEM with new formulation • Includes Gulf-specific version • Pre-season tests • Run on HFIP stream 1.5 retrospective cases • 2010-2012 sample • Only 2012 to 7 days since NHC track needed • Run for 2008-2009 cases with recon
Summary • T-CLIPER provides new extended range forecast baseline • Errors within +8% to -5% of OCD5 to 5 days • Predicts OFCL intensity error similar to OCD5 • Predicts OFCL track errors better than OCD5 • New NCEP reanalysis provides more consistent and higher resolution developmental sample • 7-day and Gulf-specific LGEM to be run in parallel in 2013 season • SHIPS/LGEM/RII being developed for W. Pacific, Indian Ocean and S. Hemisphere • Acknowledgement: This NOAA Joint Hurricane Testbed project was funded by the US Weather Research Program in NOAA/OAR's Office of Weather and Air Quality