Download
1 / 55
560 likes | 769 Views
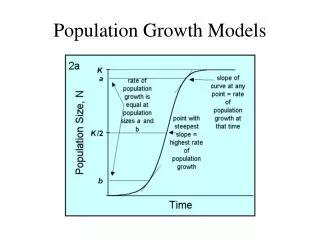
Growth Models. Raul Cruz-Cano HTLH 654 Spring 2013 University of Maryland. What is a Growth Model?. A way to assess individual stability and change, both growth and decay, over time.

E N D
Growth Models Raul Cruz-Cano HTLH 654 Spring 2013 University of Maryland
What is a Growth Model? • A way to assess individual stability and change, both growth and decay, over time. • A two-level, hierarchical model that that models (1) within individual change over time and (2) between individual differences in patterns of growth.
Growth Models Trajectory Models Growth Curve Models Latent GM Also known as:
Why Latent? • Because we assume that whatever process that is underlying the thing we are modeling (or the behavior we observe) is actually unobserved, or latent. • The characteristics we observe are a manifestation of this latent trajectory.
Why use Growth Models? • You have longitudinal data and are interested in change over time. • You may want to explain those changes. • You may also believe that not everyone follows the same path.
Hierarchical Models • Traditional: • Level 1: Students • Level 2: Schools • Growth Models (a type of HM): • Level 1: Repeated Observations • Level 2: Individuals
Unconditional Model • Level 1: Within Individual • Level 2: Between Individual
A Latent Trajectory Latent Depression Trajectory β Depressive Symptoms α Time
Time-Invariant Covariates • Level 1: Within Individual • Level 2: Between Individual
Time-Varying Variables • Level 1: Within Individual • Level 2: Between Individual Time-varying effect.
Example • “Stability and Change in Family Structure and Maternal Health Trajectories.” Meadows, McLanahan, & Brooks-Gunn. American Sociological Review. Forthcoming. • We wanted to know whether changes in family structure, including transitions into and out of coresidential relationships, had impacts on health
Example: Self-Rated Health • Mothers in FFCWS • “In general, how is your health?” • Excellent (5) • Very Good (4) • Good (3) • Fair (2) • Poor (1) • Repeated measures one, three, and five years after birth.
Models • Unconditional • Model Fit • Conditional • Time-Invariant Covariates • Time-Varying Covariates
Example (cont.) • Trajectories of maternal self-rated health and mental health problems from one year after birth to five years after birth. • Two types of measures of family structure change: • Level 1: Time-Varying • Level 2: Time-Invariant
Age at Baseline Education Race Biological Parents Mental Health Problem Lived with both Bio Parents at Age 15 Number of Previous Relationships Baseline SRH Considered an Abortion Positive Marriage Attitude Prenatal Variables (medical care, drug and alcohol use, smoking) Baseline Marital Status Time-Invariant Covariates
Mothers’ Self-Rated Health Trajectories for each Baseline Marital Status.
Time-Varying Covariate • Mothers’ Household Income • Fathers’ Mental Health • Fathers’ Earnings
Example • Results: • Transitions, especially exits from marriages, resulted in declines in mental health problems. • No growing gap in well-being between mothers who remained stably married and those remained stably single, as well as mothers who made transitions.
PROC TRAJ • PROC TRAJ is a specialized model that estimates multiple groups within the population, in contrast to a traditional regression or growth curve model that models only one mean within the population(similar to what we do “by hand” when we divide a variable the groups in a categorical variable) • It is not part of the base SAS program and must be downloaded separately. • Addressed research questions focused on describing the trajectory, or pattern, of change over time in the dependent variable, specifically questions concerned with multiple distinct patterns of change over time • Estimates a regression model for each discrete group within the population. • The focus of the Proc Traj procedure is identifying distinct subgroups within the population. • Does not provide any individual level information on the pattern of change over time; subjects are grouped and it is assumed that every subject in the group follows the same trajectory. • There is no random effect capability • In order to use Proc Traj you must organize your data in a multivariate, or “wide” format, where there is only one row of data for each subject and multiple observations included in one line of data.
PROC TRAJ • The posterior group probabilities are calculated for each individual based on the estimated parameters, and the individual is assigned to a group based on their highest posterior group probability • You have to use an iterative process to decide the best model based on the fit parameters
Options • DATA=data for analysis • OUTPUT NAMES:: • OUT= Group assignments and membership probabilities, e.g. OUT=OF. • OUTSTAT= Parameter estimates used by TRAJPLOT macro, e.g. OUTSTAT=OS. • OUTPLOT= Trajectory plot data, e.g. OUTPLOT=OP.
Options • MODEL; Dependent variable distribution (CNORM, ZIP, LOGIT) e.g. MODEL CNORM; • VAR; Dependent variables, measured at different times or ages (for example, hyperactivity score measured at age t,) e.g. VAR V1-V8; • INDEP; Independent variables (e.g. age, time) when the dependent (VAR) variables were measured, e.g. INDEP T1-T8; 1 dependent variable, and 2 independent variable which are always ID and time • ORDER; Polynomial (0=intercept, 1=linear, 2=quadratic, 3=cubic) for each group, e.g. ORDER 2 2 2 0; If omitted, cubics are used by default. • ID; Variables (typically containing information to identify observations) to place in the output (OUT=) data set, e.g. ID IDNO; • WEIGHT; Weight variable for a weighted likelihood function.
Example • This example uses data from 195 subjects in a prospective longitudinal survey. Offense convictions were recorded annually for boys from age 8 through age 32 (1 = 1 or more convictions, 0 = no convictions).
PROC TRAJ DATA=CAMBRDGE OUT=OF OUTPLOT=OP OUTSTAT=OS ITDETAIL; ID ID; VAR C1-C23; INDEP T1-T23; MODEL LOGIT; NGROUPS 2; ORDER 1 1; RUN; %TRAJPLOT(OP,OS,'Offenses vs. Time','LogisticModel','Offenses','Scaled Age')
PROC TRAJ DATA=CAMBRDGE OUT=OF OUTPLOT=OP OUTSTAT=OS; ID ID; VAR C1-C23; INDEP T1-T23; MODEL LOGIT; NGROUPS 2; ORDER 3 3; RUN; /*Creating Graph*/ %TRAJPLOT(OP,OS,'Offenses vs. Time','LogisticModel','Offenses','Scaled Age') Notice change in AIC
Now what? • In any case there are clearly 2 groups of people: • Why are they different? Look at the other independent variables
Example 2: Number of remissions PROC TRAJ DATA=TRY OUTPLOT=OP OUTSTAT=OS OUT=OF OUTEST=OE; ID ID; VAR R0-R10; INDEP T0-T10; MODEL LOGIT; NGROUPS 3; ORDER 1 2 2; RUN; %TRAJPLOT(OP,OS,'Remission vs. Time','LogisticModel','Remission','Time')
PROC TRAJ DATA=TRY OUTPLOT=OP OUTSTAT=OS OUT=OF OUTEST=OE; ID ID; VAR R0-R10; INDEP T0-T10; MODEL LOGIT; NGROUPS 4; ORDER 0 3 3 3; RUN; %TRAJPLOT(OP,OS,'Remission vs. Time','LogisticModel','Remission','Time')
PROC GLIMMIX for Counts • The GLIMMIX procedure fits statistical models to data with correlations or nonconstant variability and where the response is not necessarily normally distributed. • These models are known as generalized linear mixed models (GLMM). • The GLMMs, like linear mixed models, assume normal (Gaussian) random effects. • Conditional on these random effects, data can have any distribution in the exponential family. The exponential family comprises many of the elementary discrete and continuous distributions. • The binary, binomial, Poisson, and negative binomial distributions, for example, are discrete members of this family. The normal, beta, gamma, and chi-square distributions are representatives of the continuous distributions in this family. • In the absence of random effects, the GLIMMIX procedure fits generalized linear models (fit by the GENMOD procedure).
Basic Features The GLIMMIX procedure enables you to specify a generalized linear mixed model and to perform confirmatory inference in such models. The syntax is similar to that of the MIXED procedure and includes CLASS, MODEL, and RANDOM statements. The following are some of the basic features of PROC GLIMMIX. • SUBJECT= and GROUP= options, which enable blocking of variance matrices and parameter heterogeneity • choice of linearization about expected values or expansion about current solutions of best linear unbiased predictors • flexible covariance structures for random and residual random effects, including variance components, unstructured, autoregressive, and spatial structures • CONTRAST, ESTIMATE, LSMEANS, and LSMESTIMATE statements, which produce hypothesis tests and estimable linear combinations of effects
Notation for the Generalized Linear Mixed Model The GLIMMIX procedure determines the variance function from the DIST= option in the MODEL statement or from the user-supplied variance function. The matrix R is a variance matrix specified by the user through the RANDOM statement.
PROC GLIMMIX Contrasted with Other SAS Procedures The GLIMMIX procedure generalizes the MIXED and GENMOD procedures in two important ways. First, the response can have a nonnormal distribution. The MIXED procedure assumes that the response is normally (Gaussian) distributed. Second, the GLIMMIX procedure incorporates random effects in the model and so allows for subject-specific (conditional) and population-averaged (marginal) inference. The GENMOD procedure only allows for marginal inference. The GLIMMIX and MIXED procedure are closely related.
Example Researchers investigated the performance of two medical procedures in a multicenter study. They randomly selected5 centers for inclusion. One of the study goals was to compare the occurrence of side effects for the procedures. In each centernA patients were randomly selected and assigned to procedure “A,” and nB patients were randomly assigned to procedure “B”. The following DATA step creates the data set for the analysis.
Example data multicenter; input center group$ n sideeffect; datalines; 1 A 32 14 1 B 33 18 2 A 30 4 2 B 28 8 3 A 23 14 3 B 24 9 4 A 8 1 4 B 8 1 5 A 7 1 5 B 8 0 ; The variable group identifies the two procedures, n is the number of patients who received a given procedure in a particular center, and sideeffect is the number of patients who reported side effects.
Example If YiA and YiB denote the number of patients in center i who report side effects for procedures A and B, respectively, then—for a given center—these are independent binomial random variables. To model the probability of side effects for the two drugs, πiA and πiB, you need to account for the fixed group effect and the random selection of centers. One possibility is to assume a model that relates group and center effects linearly to the logit of the probabilities:
Example proc glimmix data=multicenter; class center group; model sideeffect/n = group / solution; random intercept / subject=center; run; The PROC GLIMMIX statement invokes the procedure. The CLASS statement instructs the procedure to treat the variables center and group as classification variables. The MODEL statement specifies the response variable as a sample proportion using the events/trials syntax. In terms of the previous formulas, sideeffect/n corresponds to YiA/niA for observations from Group A and to YiB/niB for observations from Group B
Example The SOLUTION option in the MODEL statement requests a listing of the solutions for the fixed-effects parameter estimates. Note that because of the events/trials syntax, the GLIMMIX procedure defaults to the binomial distribution, and that distribution’s default link is the logit link. The RANDOM statement specifies that the linear predictor contains an intercept term that randomly varies at the level of the center effect. In other words, a random intercept is drawn separately and independently for each center in the study. The results of this analysis are shown on the following pages.
Example Results from complete data from 15 Centers The “Parameter Estimates” table displays the solutions for the fixed effects in the model. Solutions for Fixed Effects Standard Effect group Estimate Error DF t Value Pr > |t| Intercept -0.8071 0.2514 14 -3.21 0.0063 group A -0.4896 0.2034 14 -2.41 0.0305 group B 0 . . . . Because of the fixed-effects parameterization used in the GLIMMIX procedure, the “Intercept” effect is an estimate of β0 + βB, and the “A” group effect is an estimate of βA − βB, the log-odds ratio. The associated estimated probabilities of side effects in the two groups are There is a significant difference between the two groups (p=0.0305).
Example You can produce the estimates of the average logits in the two groups and their predictions on the scale of the data with the LSMEANS statement in PROC GLIMMIX. ods select lsmeans; proc glimmix data=multicenter; class center group; model sideeffect/n = group / solution; random intercept / subject=center; lsmeans group / cl; run; The LSMEANS statement requests the least-squares means of the group effect on the logit scale. The CL option requests their confidence limits.
Example group Least Squares Means Standard group Estimate Error DF t Value Pr > |t| Alpha Lower Upper Mean A -1.2966 0.2601 14 -4.99 0.0002 0.05 -1.8544 -0.7388 0.2147 B -0.8071 0.2514 14 -3.21 0.0063 0.05 -1.3462 -0.2679 0.3085 The “Estimate” column displays the least-squares mean estimate on the logit scale, and the “Mean” column represents its mapping onto the probability scale. The “Lower” and “Upper” columns are 95% confidence limits for the logits in the two groups. The “Lower Mean” and “Upper Mean” columns are the corresponding confidence limits for the probabilities of side effects. These limits are obtained by inversely linking the confidence bounds on the linear scale, and thus are not symmetric about the estimate of the probabilities.
Poisson Distribution • Poisson distribution is for counts—if events happen at a constant rate over time, the Poisson distribution gives the probability of X number of events occurring in time T.
Poisson Mean and Variance • Mean For a Poisson random variable, the variance and mean are the same! • Variance and Standard Deviation where = expected number of hits in a given time period