Download
1 / 95
970 likes | 1.18k Views
World Fossil Energy Crisis and Fareless Urban Mass Transportation: Buying Time and Solving the Transportation Quagmire at the Same Time By John Bachar E-mail: yabachar@sbcglobal.net May 2007 Update. REFERENCES

E N D
World Fossil Energy Crisis and Fareless Urban Mass Transportation: Buying Time and Solving the Transportation Quagmire at the Same Time By John Bachar E-mail: yabachar@sbcglobal.net May 2007 Update
REFERENCES 1. Analytical paper by John Bachar: Fare-Free Mass Transit: A Case Study of What Is Now, and What Can Be In Any Metropolitan Urban Region of the USA, 2003. 2. NHA, DOT, DOE, Oil and Gas and World Oil Journals. 3. Heinberg’s book “Party’s Over”, 2003. 4. Writings of leading oil geologists Colin Campbell and Jean Laherrere, especially their articles in the Association for the Study of Peak Oil & Gas (ASPOG). 5. Transportation Energy Data Book: Edition 25, Oak Ridge National Laboratory, 2006. 6. Bureau of Transportation Statistics (BTS), U.S. Department of Transportation, National Transportation Statistics 2007.
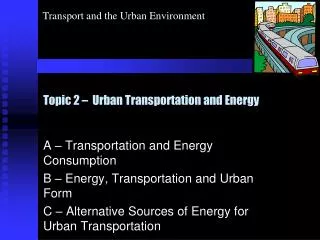
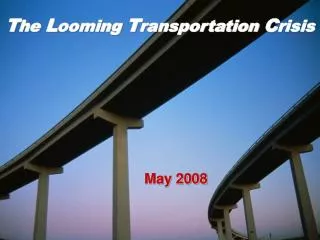
This talk will explore the world depletion of petroleum as well as the depletion of natural gas and coal, and will describe a Fareless Urban Mass Transit System (FUMTS) that can conserve well over 3.6 billion barrels of petroleum per year for all the urban regions of the USA as well as billions of barrels of savings in all the other urban regions on Earth!
WORLD AND US ENERGY DATA SOURCE/SUPPLY/CONSUMPTION DISTRIBUTION BY END-USE SECTOR
Petroleum 1. World Oil Journal states (2006) that 1.08 trillion barrels of petroleum reserves are left on Earth (probability of recovery is 90%). 2. Very little new reserves are being found. 3. World oil output will peak by 2006. 4. Hubbert found a model for life of oil production of a producing well that correctly predicted that US reserves production would peak in 1970. 5. Today the US reserve supply (2006) is less than 22 billion barrels. 6. Annual world consumption (end of 2006) is 31.03 billion barrels; US consumption (2006) is 7.514 billion barrels (24.2 per cent of world consumption!); 67 per cent of US consumption (5.03 billion barrels) is used by transportation sector; of transportation share, 4.2 billion (56 per cent) is used by highway vehicles (243 million passenger vehicles and trucks – 2004 data); the US has 32% of the world’s 754 million passenger vehicles and trucks. 7. At current rate of world consumption (1.9% annual consumption-rate increase), all petroleum will be exhausted in less than 25.4 years!! (see following table). Natural Gas and Coal 1. Estimated 1,200 trillion cubic feet of world reserves of natural gas that is estimated to last 50 years; annual USA usage is 23 trillion cubic feet; 97 percent in US is used by the residential, commercial, industrial, and electric, utilities sectors. 2. Total coal reserves are estimated at 200 to 300 years, although the easy-to-get-near-Earth’s surface share is a small percentage of the total; most is deep and requires deep mining methods for extraction; it is of little practical use for transportation. Important consideration in energy usage Energy in versus useful energy out (2nd law of thermodynamics).
Cumulative use in t years = S = P0{[(1+k)t - 1]/k} (in billions of barrels) If S is given in advance, then t = [ln(1+k(S/P0))]/[ln(1+k)] P0 = the initial annual consumption (world-wide) of petroleum (in billions of barrels) k = the annual rate of increase of world-wide consumption
WORLD PETROLEUM RESERVES: ONE TRILLION BARRELS FILLS A CUBE 3.27 MILES ON EACH SIDE ANNUAL WORLD PETROLEUM CONSUMPTION: 31.03 BILLION BARRELS (and increasing 1.9% annually) FILLS A CUBE 1.06 MILES ON EACH SIDE NUMBER OF YEARS LEFT TO EXHAUST WORLD RESERVES AT CURRENT INCREASING RATE OF CONSUMPTION: LESS THAN 25.4 YEARS!
FEDERAL HIGHWAY ADMINISTRATION [FHWA] FUNCTIONAL SYSTEM The functional classification of public streets and highways is grouped into systems according to the services they provide. PRINCIPAL ARTERIALS (PA) RURAL: A road classified as Principal Arterial (PA) serves corridor movements having trip length and travel density characteristics of statewide or interstate travel. A PA Rural route provides an integrated network without stub connections except under certain conditions such coastal city or international boundary connections. URBAN: A PA Urban route carries the major portion of trips entering and leaving urban areas as well as the majority of through movements bypassing the central city. PA serves intra-area travel (such as between major inner-city communities, between central business districts and residential areas or between major suburban centers). MINOR ARTERIALS (MA) RURAL: Rural MA roads link cities, larger towns and other important traffic generators such as resort areas into an integrated network of arterial highways. This network provides intrastate and inter-county service connecting to rural collector or local roads. URBAN: Urban MA streets and roads interconnect and expand the PA system and provide service for moderate distance and lower mobility travel. The MA system distributes travel to smaller geographic areas than the PA system. The Urban MA system may carry local bus routes and provide intra-community continuity but does not penetrate neighborhoods. COLLECTORS RURAL: Rural Collector routes generally serve travel of primarily intra-county importance rather than statewide importance. Predominant travel distances are shorter than on Arterial routes. RURAL MAJOR COLLECTORS (MJC): Rural MJC routes provide service to county seats and larger towns not served by Arterials. Rural MJC routes also link other important intra-county traffic generators such as consolidated schools, shipping points, county parks and important mining and agricultural areas. RURAL MINOR COLLECTORS (MNC): Rural MNC routes serve the more important intra-county corridors and developed areas within a reasonable distance of a major collector road. Rural MNC routes also link the locally important traffic generators in the rural areas. URBAN COLLECTORS (COL): Urban COL routes provide land access service and traffic circulation within residential neighborhoods, commercial and industrial areas. LOCAL STREETS AND ROADS Local Streets and Roads are technically not functionally classified. RURAL LOCAL (LOC): Rural LOC routes provide access to adjacent land and provide service to short distance travel. URBAN LOCAL (LOC): Urban LOC routes provide access to neighboring land or to functionally classified routes. These routes offer the lowest level of mobility and usually contain no bus routes. Through traffic movement is usually discouraged. POPULATION GROUPS The United States Bureau of Census divides communities into groups by volume of population. These groupings are used for further analysis by many agencies such as the Environmental Protection Agency (EPA) and are an important part of HPMS (Highway Performance Monitoring System) data items and analysis. RURAL ( R ) AREAS are those areas outside the boundaries of small urban and urbanized areas. The Bureau of Census defines rural areas as having a population of less than 5,000. SMALL URBAN (S) areas are defined by the Bureau of Census as having a population of 5,000 to 49,999. URBANIZED (U) areas are defined as having a population of 50,000 to 199,999. LARGE URBANIZED (L) areas pertain to larger urban areas having a population of over 200,000.