Download

1 / 33
350 likes | 569 Views
The pulse wave. c is pulse wave velocity u is blood velocity (u<<c) is density of blood. The speed of the wave increases as arterial stiffness increases. Increase stiffness by 2 increase wave speed of 1.4. Increase stiffness by 4 increase wave speed of 2.

E N D
c is pulse wave velocity u is blood velocity (u<<c) is density of blood The speed of the wave increasesas arterial stiffness increases Increase stiffness by 2 increase wave speed of 1.4 Increase stiffness by 4 increase wave speed of 2
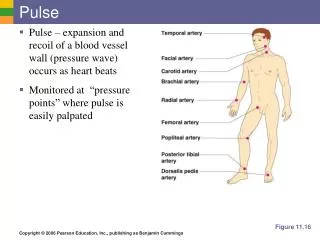
How to measure wave speed • Detect pulse wave at two sites a known distance apart • Measure time it takes for the pulse wave to get from one site to the other (transit time,TT) • Speed = distance/time
Methods for the measurement of PWV • Tonometry : Pressure wave detection. • Good sensitivity and time resolution. • Very sensitive to arterial movement. • Superficial arteries only. • Doppler ultrasound : Flow wave detection. • Widely used. • Ability to detect deeper vessels. • Photoplethysmography (PPG) :Diameter wave detection. • High sensitivity and time resolution. • Very easy to use. • Superficial arteries only. (Eliakim et al. Am Heart J, 1971. 82: 448.)
Upstream probe Downstream probe Infra red emitter Detector Optical detection of the diameter wave SKIN ARTERY FLOW MUSCLE/BONE Loukogeorgakis, et al. (2002). Physiological Measurement 23: 581-96.
LED (emitter) Photo-transistor (detector) 20 mm
Source A B (Units mm-1) Highly scattering region (skin and wall) Weakly scattering region (blood)
Validation experiments. Comparison of PPG with • Echo Tracking. • Does PPG method really measure diameter? • Doppler. • How well do PPG derived pulse wave transit times compare to measurements using an established method? • Intra-arterial pressure wave. • Do transcutaneous transit time and PWV measurements compare with intra-arterial ones?
PPG/Echo Tracking - Methods. • 6 subjects (age range 20-47). • Subjects lay supine. • ECG reference signal obtained by a two electrode chest strap. • Diameter was measured at the radial artery using an high precision echo tracking ultrasound system (NIUS, Omega Electronics, Switzerland). • PPG probe positioned between 5 and 10 mm distal to the ultrasonic probe. • Simultaneous recordings taken for 30 seconds. • Procedure repeated with both probes placed over the right dorsalis pedis artery. • Time measured between ECG R wave and ‘foot’ of the diameter wave. • Timing and shape of curve from each probe compared by Fourier analysis
PPG Ultrasound 1 PPG Ultrasound Relative amplitude 0.1 0.01 400 300 Phase 200 100 0 0 2 4 6 8 10 Frequency (Hz)
PPG/Echo Tracking - Conclusions. PPG faithfully reproduces the diameter wave, when compared to high precision echo tracking system.
Validation experiments. Comparison of PPG with • Echo Tracking. • Does PPG method really measure diameter? YES! • Doppler. • How well do PPG derived pulse wave transit times compare to measurements using an established method?
PPG/Doppler Methods. Comparison of PPG and Doppler ultrasound estimates of pulse wave transit time. • 10 subjects (age range 20 - 53). • Subjects lay supine. • ECG reference signal obtained by a two electrode chest strap. • 8 MHz pencil type Doppler probe placed over the left radial artery at the wrist. • PPG probe placed < 5mm proximal to Doppler probe. • Simultaneous recordings made for 20 seconds. • Procedure repeated with probes placed over the left dorsalis pedis artery. • Time delay between ECG R wave and the ‘foot’ of the Doppler and PPG waves was measured.
PPG/Doppler hardware. PPG CPU Amplifier Multiplexer A/D converter ECG Doppler
Comparison of PPG and Doppler transit times TT PPG [ms] y = 0.90x + 12.8 r = 0.95 350 300 250 Leg 200 Arm 150 100 100 150 200 250 300 350 TT Doppler [ms]
Comparison of PPG and Doppler.Difference v mean Doppler - PPG [ms] 50 + 2SD 25 Leg 0.0 Arm -25 - 2SD -50 0 100 200 300 400 Average [ms]
PPG/Doppler - Conclusions. • PPG transit times agree well with Doppler values recorded at the ‘same’ site. • The difference plot shows • the difference between the PPG and the Doppler values is independent of the mean of each pair of estimates • the transit time estimated by the Doppler instrument is consistently greater than that derived from the PPG signals (mean difference 8.6 ms) • The discrepancy may be due to the Doppler signal processing • (further experiments will test this).
Validation experiments. Comparison of PPG with • Echo Tracking. • Does PPG method really measure diameter? • Doppler. • How well do PPG derived pulse wave transit times compare to measurements using an established method? YES! Not bad! • Intra-arterial pressure wave. • Do transcutaneous transit time and PWV measurements compare with intra-arterial ones?
Subjects • 21 subjects (8 female). • Age range 33 to 78 years, (mean 57 years). • Measurements in all subjects were performed after routine coronary angiography, under the approval of the regional research ethics committee.
PPG/Intra-arterial hardware. PPG Amplifier Multiplexer A/D converter CPU ECG Catheter Laboratory Electronics Pressure
TP1 Pressure measurement pos. 1 ECG Femoral arteriotomy Inguinal ligament
TP = TP2-TP1 +TC PWVP = DP/ TP TPPG = TPPG-TP1 PWVPPG = DPPG/ TPPG TP2 TPPG TC PPG measurement pos. TP1 Pressure measurement pos. 1 ECG Pressure measurement pos. 2 Femoral arteriotomy Inguinal ligament
Comparison of PPG and intra-arterial transit times PPG transit time [ms] 110 y = 0.68x + 22, r = 0.66, P < 0.005 100 90 80 70 60 50 40 40 50 60 70 80 90 100 110 Intra arterial transit time [ms]
Comparison of PPG and intra-arterial transit times.Difference v mean I.A. - PPG [ms] 30 + 2SD 20 10 0.0 -10 -20 - 2SD -30 40 50 60 70 80 90 100 110 Mean transit time [ms]
PPG PWV [ms-1] y = 0.77x + 1.9 r = 0.62, P < 0.005 14 12 10 8.0 6.0 6 8 10 12 14 Intra-arterial PWV [ms-1] Comparison of PPG and intra-arterial pulse wave velocities
Comparison of PPG and intra-arterial PWV.Difference v mean PWV I.A. - PWV PPG [ms-1] 4.0 + 2SD 2.0 0.0 y = 0.24x + 2.2, r = 0.23, P: NS -2.0 - 2SD -4.0 6 8 10 12 14 Mean PWV [ms-1]
Some limitations of the study. • Non simultaneous measurement of proximal and distal signals • Ethical constraint of one catheter • Proximal signal not transcutaneous • ‘Hybrid’ measurements will avoid this. i.e. aortic signal from Doppler, distal signal from PPG. • Current hardware and software will allow this. • Effect of errors in distance between measurement sites not investigated • Careful comparison between I.A. and external distance measurements required.
PPG/Intra-arterial - Conclusions. • Good correlation between intra-arterial and PPG transit times and pulse wave velocities. • Mean difference between the two methods close to zero • Slight but non-significant tendency for difference between I.A. and PPG to increase with increasing PWV. • Transcutaneous estimation of pulse wave transit time provides an acceptable estimate of its intra-arterial value. • Differences due to errors in external length measurement?
TT PPG [ms] PPG 350 y = 0.90x + 12.8 r = 0.95 300 250 Leg 200 Arm 150 100 U/S 100 150 200 250 300 350 TT Doppler [ms] PPG PWV [ms-1] 14 TT PPG [ms] 350 12 300 10 250 8 200 6 150 6 8 10 12 14 Intra-arterial PWV [ms-1] 100 100 150 200 250 300 350 TT Doppler [ms] Validation experiments. Comparison of PPG with: Echo Tracking. Similar waveforms in radial & dorsalis pedis arteries show that PPG method does measure large artery diameter. • Doppler. • PPG derived pulse wave transit times compare well with measurements using an established method. • Intra-arterial pressure wave. • Do transcutaneous transit time and PWV measurements compare with intra-arterial ones? Reasonably well
Repeatability studies. • Variation of aortic PWV over different time scales • (A) 3 separate recording sessions 10 minutes apart. • (B) 4 separate recording sessions made at three hourly intervals.