Download
1 / 59
590 likes | 767 Views
Applications of Satellite Data to Tropical Cyclone Intensity Forecasting. Mark DeMaria, RAMM Branch NOAA/NESDIS/StAR, Fort Collins, CO. JPL Seminar February 8, 2007. Outline. Tropical cyclone track and intensity forecast skill Intensity forecast models

E N D
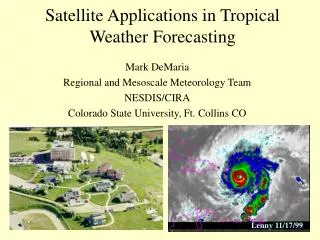
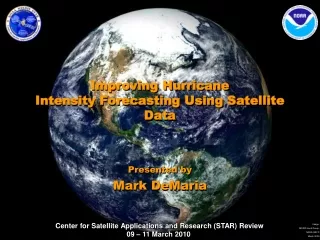
Applications of Satellite Data to Tropical Cyclone Intensity Forecasting Mark DeMaria, RAMM Branch NOAA/NESDIS/StAR, Fort Collins, CO JPL Seminar February 8, 2007
Outline • Tropical cyclone track and intensity forecast skill • Intensity forecast models • Satellite data in numerical weather prediction models • Satellite data in statistical intensity models • Future Improvements • Hurricane WRF model • NPOESS and GOES-R
JTWC CPHC NHC JTWC U.S. Forecast Areas of Responsibility
National Hurricane Center Tropical Cyclone Forecast Parameters • Track • tropical cyclone positions 0 to 120 hr • Intensity • maximum wind 0 to 120 hr • Wind Structure • Radii of 34, 50 kt winds 0 to 72 hr • Radii of 64 kt winds 0 to 36 hr • Watches • Hurricane conditions possible in next ~36 hr • Warning • Hurricane conditions likely in next ~24 hr • Probabilities of 34, 50 and 64 kt winds 0 to 120 hr • All forecast products updated every 6 hours
Mean Absolute Error of NHC Official Atlantic Track and Intensity Errors1985-2006
Evaluation of Forecast Skill • Compare forecasts to “No Skill” benchmark • Benchmark models are statistical forecasts with very simple input parameters • Current position and intensity and their time tendencies • Climatology (Julian Day) • CLIPER is track benchmark model • SHIFOR is intensity benchmark model • Skill is measured by percent improvement over CLIPER or SHIFOR
Factors Affecting Track and Intensity • Track • Steering by winds surrounding the storm • Storm size • Inner core details of secondary importance • Intensity • Interaction with storm environment • Surface fluxes and cloud microphysics • Ocean response and feedback • Interaction with land • Inner core details fundamental
GFS 500 hPa Wind AnalysisHurricane Wilma 23 Oct 2005 at 12 UTC
Hurricane Katrina 28 Aug 2005 GOES Rapid Scan IR Imagery
Structure of Hurricane Isabel 13 Sept 2003 500 km 200 km 2000 km GOES IR Window Ch 50 km GFS 200 hPa AnalysisFlight Level Wind Speed MODIS Vis Ch
NHC Track and Intensity Forecast Models • Track • Global NWP models • NCEP GFS, Navy NOGAPS, UKMET, ECMWF • Regional models • NCEP/GFDL hurricane model, NCEP hurricane WRF • Intensity • NCEP/GFDL hurricane model • Statistical Hurricane Intensity Prediction Scheme (SHIPS) • Florida State Super-Ensemble (experimental)
The GFDL Modeling System • Regional-Scale, Moving Nest, Atmospheric Modeling System. • Hydrostatic sigma coordinates • Initialized with GFS global model analysis • Special treatment for storm scale • Parameterizations • SAS convection scheme, • GFS surface, boundary layer physics • GFDL radiation and simple rain removal for grid scale precipitation. • Ocean coupled modeling system.
The SHIPS Model • Statistical-regression model • 18 basic predictors • atmospheric from GFS forecast fields • oceanic from Reynold’s weekly SST • ocean heat content from altimetry • cloud top structure from GOES • climatology and persistence • Empircal decay rate over land
Inclusion of Satellite Data in Hurricane Intensity Models • Dynamical Models (GFDL, WRF, etc) • Advanced data assimilation techniques • Statistical Models • Include predictors from satellite data • SHIPS satellite predictors • Ocean heat content from satellite altimetry • Convective structure from GOES • Experimental version with microwave imagery
HIRS sounder radiances AMSU-A sounder radiances AMSU-B sounder radiances GOES sounder radiances GOES, Meteosat, GMS winds GOES precipitation rate SSM/I precipitation rates TRMM precipitation rates SSM/I ocean surface wind speeds ERS-2 ocean surface wind vectors Quikscat ocean surface wind vectors AVHRR SST AVHRR vegetation fraction AVHRR surface type Multi-satellite snow cover Multi-satellite sea ice SBUV/2 ozone profile and total ozone AIRS MODIS Winds Altimeter sea level observations (ocean data assimilation and wave data assimilation system) Satellite data used in NCEP’soperational data assimilation systems (From S. Lord,NCEP/EMC Ocean winds Workshop, TPC,June 2006)
Classification of Satellite Input • Satellite Radiances (IR and microwave sounders) • T , water vapor and trace gas (e.g. ozone) profiles • Indirect impact on wind through assimilation • Satellite winds • Feature track winds • Scatterometer (QuikSCAT and Windsat) • Satellite precipitation and TPW estimates • Model moisture condensate variables • Land and sea surface properties • Boundary conditions and atmosphere-ocean interface variables • Satellite altimetry • Sub-surface ocean structure
AMSU Weighting Functions Temperature Channels Moisture Channels
Examples of Satellite Winds for Hurricane Ivan 2004 QuikSCAT Surface Winds GOES Feature Tracked Low-Level Winds
Jason/GFO Altimeter Tracks Used in NHC Ocean Heat Content analysis system (Pre-Katrina case) Ocean Surface Height Anomaly (Pre-Katrina Case)
GFDL Model Intensity Forecasts for Hurricanes Gordon and Ernesto (2006) Gordon Ernesto
Inclusion of Satellite Data in the SHIPS Intensity Model • SHIPS uses multiple regression to relate empirical predictors to maximum wind changes • Large database of cases is needed for statistical development • Two types of satellite data current included • Ocean Heat Content from Satellite Altimetry • Convective structure variables from GOES
SST Influence on Tropical Cyclones • Shaw (1922) • TCs only exist over warm water • Palmen (1948) • SST 26oC is needed for TCs • Miller (1958), Emanuel (1988) • SST provides upper bound on intensity • Maximum Potential Intensity • Ooyama (1969), Yamasaki (1968), + many others • Numerical model simulations sensitive to SST and surface flux treatment
Upper Ocean Response • Fisher (1958) • TCs induce cooling that affects surface fluxes • Leipper (1967), Landis and Leipper (1968) • Upwelling and mixing can reduce SST by up to 5oC • Giesler (1970) • barotropic/baroclinic response, hurricane “wake” • Chang and Anthes (1978) • Little impact of SST feedback on model TC • Sutyrin and Khain (1984) • SST feedback can be significant in 3-D model • Shay (2000) and others • Response of Opal to warm core ocean eddy • Lilibridge (2005) • Response of Hurricane Katrina to warm core ocean eddy
Composite AVHRR SST from Hurricane Isabel 2003. Note the cold wake from hurricane Fabian. (From Johns Hopkins University Ocean Remote Sensing Group web page)
Satellite Altimetry • Ocean altimetry provides routine measures of upper ocean heat content • Topex/Poseidon, GFO, Jason, Envisat • Integrated heat excess from depth of 26oC isotherm to the surface • NHC operational algorithm (Atlantic basin) • AOML experimental algorithm (global) • Tropical Cyclone Heat Potential (TCHP)
Hurricane Katrina Intensity and SST and NHC Ocean Heat Content Analysis OHC SST
Hurricane Isabel Intensity and NHC Ocean Heat Content Analysis
Intensity Forecast Applications • Is there an atmospheric response to OHC changes? • How important is the OHC for the typical tropical cyclone intensity forecast? • Average intensity of Atlantic TC is only ~ 60 kt • Statistical results from SHIPS model
Atmospheric Response to OHCHurricane Ivan (2004) Example • Rapid variations in OHC from • 13 Sept 18 UTC to 15 Sept 18 UTC • Response in IR imagery • Response in low level e near storm • center from aircraft recon data
Sample e Analysis for Ivan Analyzed e (oK-300) U.S. Air Force Reserve flight level (700 hPa) winds
Inclusion of OHC in SHIPS • OHC predictor adds small, but statistically significant improvement • Intensity errors reduced by only ~1% • Very minor effect for the typical storm • Statistically significant improvement only when threshold of 60 KJ/cm2 is applied
Adjustment of SHIPS Intensity Forecast due to OHC predictor ___ - OHC + (------------ ------------)
Impact on SHIPS Forecasts for Category 5 Storms since OHC was added • Isabel (03), Ivan (04), Emily, Katrina, Rita, Wilma (05) • Verify only over-water part of forecast
CIRA archive of more than 100,000 GOES IR images Two GOES predictors significant for SHIPS Percent inner core pixels colder than -40oC Inner-core brightness temperature standard deviation (symmetry parameter) GOES Input to SHIPS
SHIPS Improvements due to Combined Satellite Data Input (From DeMaria et al 2005, WF)
SHIPS has Limited Ability for Prediction of Rapid Intensification Scatter-plot of Forecast vs Observed 48-hr Intensity Change (Operational Atlantic SHIPS forecasts)
Future Intensity Forecast Improvements • NCEP Next Generation Hurricane Prediction System (H-WRF) • New Satellite Observations • Hyperspectral IR, Cloudsat/Calipso, COSMIC, NPOESS, GOES-R
Hurricane-Wave-Ocean-Surge-Inundation Coupled Models NCEP/Environmental Modeling Center Atmosphere- Ocean-Wave-Land NOS land and coastal waters HWRF SYSTEM NMM hurricane atmosphere NOAH LSM runoff High resolution Coastal, Bay & Estuarine hydrodynamic model surge inundation fluxes Atmosphere/oceanic Boundary Layer radiative fluxes winds air temp. other fluxes elevations currents 3D salinities temperatures SST currents HYCOM 3D ocean circulation model wave spectra WAVEWATCH III Spectral wave model wave fluxes (From N. Surgi, IHC, 2006)
NCEP H-WRF Improvements • Coupling with land, ocean, wave models • Improved numerical solution techniques • Improved parameterizations • Higher spatial resolution • Advanced data assimilation • Including inner core data from aircraft and land-based Doppler • Can also provide storm structure forecasts • Tentative implementation in 2007
Results from Research H-WRF Sample includes 35 forecasts from 2004 and 2005 (C. Davis et al 2007)
Wind structure forecasts from Research H-WRF Model – color contours Obs – black contours (C. Davis et al, 2007)
New Satellite Tools for Tropical Cyclone Analysis • Hyperspectral IR Sounders • Cloudsat/Calipso • COSMIC vertical profiles • NPOESS/GOES-R • Early next decade
Hyperspectral IR Sounders • Currently available from AIRS on AQUA • Soon to be available on Met-Op (IASI) • Planned for NPOESS • Will provide vastly improved vertical resolution for temperature and moisture soundings