Download
1 / 15
160 likes | 256 Views
1.10 VARIABILITY AND STATISTICS. 1.10.1 Introduction 1.10.2 Sampling 1.10.3 Correlations. Questions for the Engineer. How far above the failure level does the average measurement have to be in order to get a given percentage of defects ?

E N D
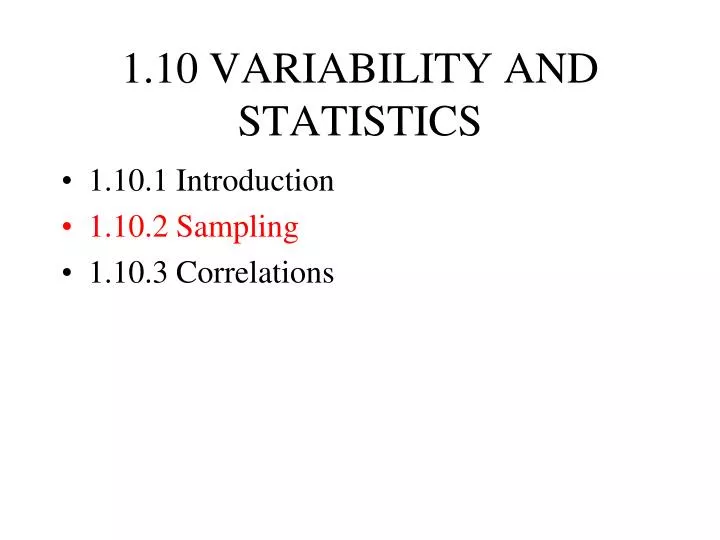
1.10 VARIABILITY AND STATISTICS • 1.10.1 Introduction • 1.10.2 Sampling • 1.10.3 Correlations
Questions for the Engineer • How far above the failure level does the average measurement have to be in order to get a given percentage of defects ? • How likely is it to observe a relatively large number of failures in a small sample taken from a parent population with a low percentage of defects ?
An example of a normal distribution • A large number of people each toss a coin 100 times and record the number of heads they get. The results are normally distributed with a mean of 50.
Standard Deviation and Mean (not using Excel) where xi are the observations, m is the mean and n is the number of observations
Normal Distribution mean = failure level + z standard deviation.
Percentage failure permitted z value 16 1.00 10 1.28 5 1.64 2.5 1.96 2 2.05 1 2.33 A table of z (or n) values for various values of percentage failures
Questions for the Engineer • How far above the failure level does the average measurement have to be in order to get a given percentage of defects ? • How likely is it to observe a relatively large number of failures in a small sample taken from a parent population with a low percentage of defects ?
Rolling a dice • There is a probability of one in six that a six will be rolled. • If this is considered to be a failure the probability of two failures in two measurements will be 1/6 1/6 = 1/36. • The probability of one failure in two observations will be 2 1/6 5/6 = 10/36. The factor 2 is used because the failure could be the first or the second observation. • The probability of no failures in two observations will be 5/6 5/6 = 25/36. It may be seen that this is the most probable outcome.
Outcomes for rolling two dice and counting a 6 as a failure • Dice 1: Pass, Dice 2: Pass 5/6 × 5/6 = 25/36 • Dice 1: Fail, Dice 2: Pass 1/6 × 5/6 = 5/36 • Dice 1: Pass, Dice 2: Fail 5/6 × 1/6 = 5/36 • Dice 1: Fail, Dice 2: Fail 1/6 × 1/6 = 1/36 • Total = 36/36
Testing 3 cubes with a probability of failure of 5% (=0.05) for each cube P=Pass, F=Fail P P P 0.953 = 0.857 P P F P F P 0.952× 0.05 × 3 = 0.135 F P P F F P F P F 0.052× 0.95× 3 = 0.007 P F F F F F 0.053 = 0.0001
1.10 VARIABILITY AND STATISTICS • 1.10.1 Introduction • 1.10.2 Sampling • 1.10.3 Correlations
Correlations r2 = 0.52 r = 0.72
Use of correlation • What we want to know is whether it is necessary to attend the lectures to pass the exam. • What statistics can tell us is what the probability is that this is a purely random distribution with no "correlation" at all.
No of data points r for 5% significance r for 1% significance 5 .754 .874 10 .576 .708 20 .423 .537 30 .349 .449 40 .304 .393 50 .273 .354 r values