Download
1 / 7
70 likes | 78 Views
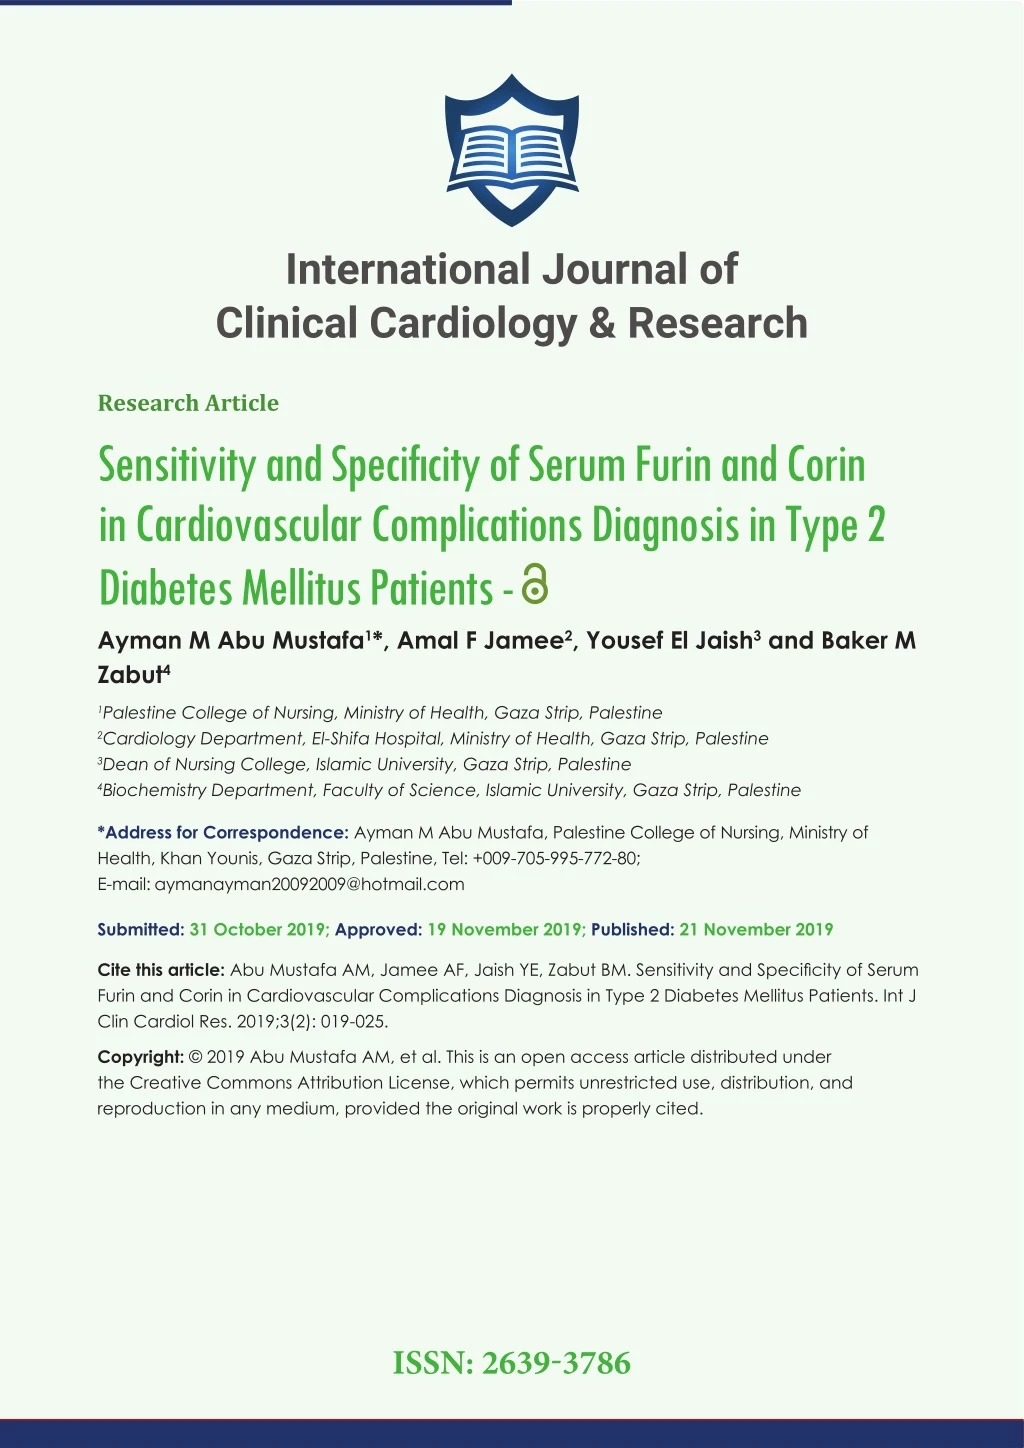
Background: Cardiovascular Diseases (CVD) are the highest-incidence cause of death and morbidity in patients with type 2 Diabetic (T2DM). The natriuretic peptide is important in controlling blood pressure and salt water balance. Both corin and furin are involved in cleave Pro-Atrial Natriuretic Peptide (ANP) and Pro-BNP (Brian Natriuretic Peptide) into their active forms (ANP and BNP). Recently,<br>studied showed that furin and corin defects could contribute to CVDs.

E N D
International Journal of Clinical Cardiology & Research Research Article Sensitivity and Specifi city of Serum Furin and Corin in Cardiovascular Complications Diagnosis in Type 2 Diabetes Mellitus Patients - Ayman M Abu Mustafa1*, Amal F Jamee2, Yousef El Jaish3 and Baker M Zabut4 1Palestine College of Nursing, Ministry of Health, Gaza Strip, Palestine 2Cardiology Department, El-Shifa Hospital, Ministry of Health, Gaza Strip, Palestine 3Dean of Nursing College, Islamic University, Gaza Strip, Palestine 4Biochemistry Department, Faculty of Science, Islamic University, Gaza Strip, Palestine *Address for Correspondence: Ayman M Abu Mustafa, Palestine College of Nursing, Ministry of Health, Khan Younis, Gaza Strip, Palestine, Tel: +009-705-995-772-80; E-mail: Submitted: 31 October 2019; Approved: 19 November 2019; Published: 21 November 2019 Cite this article: Abu Mustafa AM, Jamee AF, Jaish YE, Zabut BM. Sensitivity and Specifi city of Serum Furin and Corin in Cardiovascular Complications Diagnosis in Type 2 Diabetes Mellitus Patients. Int J Clin Cardiol Res. 2019;3(2): 019-025. Copyright: © 2019 Abu Mustafa AM, et al. This is an open access article distributed under the Creative Commons Attribution License, which permits unrestricted use, distribution, and reproduction in any medium, provided the original work is properly cited. ISSN: 2639-3786
International Journal of Clinical Cardiology & Research ABSTRACT Background: Cardiovascular Diseases (CVD) are the highest-incidence cause of death and morbidity in patients with type 2 Diabetic (T2DM). The natriuretic peptide is important in controlling blood pressure and salt water balance. Both corin and furin are involved in cleave Pro-Atrial Natriuretic Peptide (ANP) and Pro-BNP (Brian Natriuretic Peptide) into their active forms (ANP and BNP). Recently, studied showed that furin and corin defects could contribute to CVDs. Methods: This study includes 360 subjects divided into three groups; 120 healthy subjects as controls (Gr I); 120 T2DM patients with no medical history of CVD (Gr II) and 120 T2DM patients confi rmed diagnosis of CVD (Gr III). All groups were matched for age and gender. All subjects were investigated for biochemical markers, serum corin and furin levels were determined By ELISA techniques. Result: Human corin level in T2DM patients with and without CVDs was signifi cantly lower than the control group, while furin level were signifi cantly higher in T2DM with CVDs compared to T2DM patients without CVDs and control groups. Furin was found to be more sensitive than corin (72.5% vs. 46.7%, p < 0.01), Also furin showed higher specifi city when compared with corin (96% vs. 84%, p < 0.05) and corin (92.5% vs. 72.5%, p < 0.0001) in predicting cardiovascular complications in T2DM patients. Conclusions: Results of this study suggested that serum furin and corin associated with CVDs development but furin showed higher specifi city and sensitivity so, it may be serve as a biomarker in CVDs diagnoses in T2DM patients. Keywords: Corin; Furin; Cardiovascular disease; Type-2 Diabetic; Palestinian INTRODUCTION Type 2 Diabetes Mellitus (T2DM) has become one of the most important chronic public health problems [1]. Cardiovascular Diseases (CVDs) are the primary cause of mortality and morbidity in patients with T2DM [2,3]. An estimated 17.3 million people died from CVDs in 2008 and the number of people who die from CVDs will increase to reach 23.3 million by 2030 [4]. CVDs represented the primary cause of Palestinian mortalities reported in 2010, amounting to 25.4% of the total number of deaths [5,6]. present study was designed to compare the diagnostic accuracy of corin and furin in predicting CVDs in T2DM patients. PATIENTS AND METHODS Study design and population A total of 240 patients were recruited in this case–control study, including 120 T2DM patients without CVDs, who were referred to the outpatient clinic of the diabetic clinic center, Gaza strip, Palestine and 120 T2DM patients with CVDs, who were referred to the cardio care unit of the Cardiology Department, El-Shifa Hospital, Gaza strip, Palestine. In addition, 120 healthy subjects, who underwent routine medical checkups at El-Shifa Hospital and had no medical history of CVDs, were recruited as controls who were selected based on normal clinical and laboratory fi ndings. Participants who had conditions that might aff ect the natriuretic system such as diseases of the liver, chronic kidney disease, pulmonary hypertension, chronic obstructive lung disease, congenital heart disease, critical valvular heart disease, autoimmune diseases or malignant disease were excluded. Th e study protocol was approved by the scientifi c ethical committee of Faculty of Science, Islamic University, Gaza strip, Palestine. A written informed consent was obtained from all the enrolled patients and healthy subjects prior to inclusion into the study in accordance with the Declaration of Helsinki. In response to volume or pressure overload, the expression of Atrial Natriuretic Peptide (ANP) and brain or B-Type Natriuretic Peptide (BNP), the cardiac peptide hormones, is highly up regulated, increasing their production in the heart and their release into the circulation. Compared to ANP, BNP has emerged as a superior biomarker for left -ventricular dysfunction and Chronic Heart Failure (CHF) [7]. Th e human BNP gene encodes a 134-amino acid pre-pro- BNP. Th e removal of an amino terminal 26-amino acid signal peptide from pre-pro-BNP yields a 108-amino acid pro-BNP. Processing of pro- BNP1-108 by a proprotein convertase during release into circulation, results in the physiologically active 32-amino acid carboxyl-terminal molecule (BNP77-108) and an inactive amino-terminal fragment (NT-pro-BNP1-76) [8,9]. Clinical evaluation of the participants Two proprotein convertases, corin [10] and furin [11], are considered the most likely pro-BNP processing enzymes. Corin is a type II transmem- brane serine protease [11] that has been identifi ed as the physiological ‘‘pro-ANP [12] and pro-BNP [13] convertase’’. Th e enzyme is highly expressed in the heart [10], primarily in cardiomyocytes [14], where it unique cleaves the inactive natriuretic peptide precursor molecules into biologically active peptide hormones [15]. Furin is a ubiquitously expressed type I transmembrane serine protease involved in the proteolytic processing of a wide range of precursor proteins [16]. In patients with HF, plasma levels of unprocessed natriuretic peptides are highly elevated [8], suggesting that corin and/or furin activity could not be compensated adequately to meet the demand under the pathological condition [17,18]. At the time of study baseline, each participant enrolled in the study was thoroughly surveyed according to a self- administered questionnaire which was recorded by trained research staff . Clinical diagnosis and defi nitions DM was diagnosed according to criteria set by the American Diabetes Association. DM was defi ned as the presence of one of the following: (1) a fasting plasma glucose of 126 mg/dl or (2) a self-reported history of DM and current use of either insulin or an oral hypoglycemic medication (American Diabetes Association, 2009). Th e diagnosis of CVDs was performed according to the current guidelines by experienced cardiologists who cared for the patients but were blinded to the study [19,20]. Measurement of plasma corin and furin levels Th e role of corin and furin in the pathophysiology of CVDs remains incompletely understood. In view of the clinical importance of predicting the development of CVDs in patients with T2DM, the Venous Ethylenediaminetetraacetic Acid (EDTA) - vacutainer tubes (BD diagnostics, Franklin Lakes, NJ) by venipuncture. Plasma samples blood samples were collected into SCIRES Literature - Volume 3 Issue 2 - www.scireslit.com Page -0020
International Journal of Clinical Cardiology & Research were immediately obtained, aliquoted in sterile polypropylene tubes and stored at 80C until analysis. Plasma levels of Corin and furin were measured using commercial enzyme-linked immunosorbent assays (ELISAs; Abnova, Taipei, Taiwan) following the manufacturer’s instructions. Table 1: Demographic data of the studied groups. Groups Demographic variables P - value T2DM without CVD (n = 120) Controls (n = 120) T2DM with CVD (n = 120) Smoking Yes No Employ Yes No HTN Yes No HTN Yes No Corin ELISA is capable of recognizing both recombinant and natural human corin. According to the manufacturer’s protocol, the minimum detectable concentration of corin ELISA was found to be 5.64 pg/ mL. Moreover, no signifi cant corin ELISA cross-reactivity with Enterokinase, Histone acetyltransferase or Spinesin. 22 (18.3) 98 (81.7) 23 (19.2) 97 (80.8) 27 (22.5) 93 (77.5) 0.694 47 (39.2) 73 (60.8) 68 (56.7) 52 (43.3) 41 (34.2) 79 (65.8) 0.001 Furin ELISA is able to recognize both recombinant and natural human furin. According to the manufacturer s protocol, the minimum detectable concentration of furin ELISA was found to be 15 pg/ mL. Furthermore, no signifi cant furin ELISA cross-reactivity was observed with any of the following proteins and cytokines: Angiogenin, Brain- derived neurotrophic factor, Leptin, Granulocyte-macrophage colony- stimulating factor, Monocyte chemoattractant protein-1 (MCP-1), MCP-2, MCP-3, Transforming growth factor beta, Tumor necrosis factor alpha (TNF-a), TNF-b, Vascular endothelial growth factor, Interleukin1 (IL-1), IL-2, IL-3, IL-4, IL-5, IL-6, IL-7, IL-8, IL-9, IL-11, IL-12, IL-13, IL-15 and Interferon gamma. 0 (0) 29 (24.2) 91 (75.8) 85 (70.8) 35 (29.2) 0.000 120 (100) 0 (0) 29 (24.2) 91 (75.8) 85 (70.8) 35 (29.2) 0.000 120 (100) Family history HTN Yes No Family history DM Yes No Family history CAD Yes No Family history stroke Yes No Family history PAD Yes No 3 (2.5) 117 (97.5) 23 (19.2) 97 (80.8) 72 (60) 48 (40) 0.000 8 (6.7) 112 (93.3) 12 (10) 108 (90) 85 (70.8) 35 (29.2) 0.000 0 (0) 0 (0) 19 (15.8) 101 (84.2) 0.000 Statistical analysis 120 (100) 120 (100) Categorical variables were reported as the number of cases (percentage) and compared using the Pearson’s chi-square test. Th e continuous variables were expressed as mean ± Standard Deviation (SD) if normally distributed and compared using the independent Student’s t-test or one-way analysis of variance as appropriate. Normality was assessed by the Shapiro-Wilk test. A two-sided probability (p) value was used for all statistical analyses, and a p value of 0.05 was considered statistically signifi cant. Th e correlation of corin and furin levels with continuous variables was analyzed using Pearson correlation coeffi cient because data were normally distributed. Receiver Operating Characteristic (ROC) curve analysis was performed to determine the diagnostic value of corin and furin levels (Table 1). Data statistical analyses were performed using the statistical package for the social sciences (SPSS Statistics for Windows, Version 23.0; IBM Corp., Armonk, NY). RESULTS Baseline characteristics of the study cohort. Th e study cohort was divided into three groups: 120 healthy subjects, 120 T2DM patients without CVDs and 25 T2DM patients with CVDs. Th e clinical and biochemical characteristics of the patients and healthy subjects are listed in Tables 2,3, respectively. Furin levels was found to be signifi cantly higher in T2DM patients with CVDs than those in T2DM patients without CVDs and those in healthy subjects. Furthermore, furin levels was higher in T2DM patients without CVDs than those in healthy subjects. However, corin levels appeared to be signifi cantly higher in healthy subjects than those in T2DM patients with or without CVDs. Moreover, corin levels were higher in T2DM patients without CVDs than those in T2DM patients with CVDs (Table 3). 0 (0) 3 (2.5) 117 (97.5) 13 (10.8) 107 (89.2) 0.000 120 (100) 3 (2.5) 117 (97.5) 13 (10.8) 107 (89.2) 3 (2.5) 117 (97.5) 0.004 level was positively correlated with BMI, duration DM, SBP, FBS, creatinine, uric acid, cholesterol, TG, LDL-C, CK, CK-MB, LDH levels in study population. In contrast, corin level was negatively correlated with height, weight, diastolylic BP, Hb and HDL-C (Table 5). ROC curve analysis Th e sensitivity of CVDs diagnosis in T2DM patients by furin level was higher than that by corin. Furthermore, in T2DM patients, the specifi city of CVDs diagnosis by furin level higher than that by corin. Diff erences in the Positive Predictive Value (PPV), Negative Predictive Value (NPV), accuracy and Area under the Curve (AUC) between furin and corin (Table 6 and Figure 1). DISCUSSION Th e incidence of diabetes is escalating worldwide and, consequently, this has become a major healthcare problem. Moreover, T2DM is associated with signifi cantly accelerated rates of microvascular and macrovascular complications [1]. However, the molecular mechanisms underlying the high incidence of diabetic complications are still not fully understood. When cardiovascular complications progress to an end stage, medical options are limited. Th us, timely diagnosis and early intervention are important for managing these life-threatening diseases [2]. BNP is a cardiac hormone, released from the cardiac ventricles in response to increased myocardial stretch or wall tension [21]. When ventricular myo- cytes secrete pro-BNP108, furin, corin or other currently unknown proteases are thought to cleave pro-BNP108 to pro- BNP77-108 (BNP-32), which is considered to be the biologic- Correlation of plasma corin and furin levels with other variables Corin level was positively correlated with Height, SBP, Hb and HDL-C levels in study population. In contrast, corin level was negatively correlated with SBP, Furin, FBS, Creatinine, Uric Acid, Cholesterol, TG, LDL-C, CK, CK-MB and LDH (Table 4). Corin SCIRES Literature - Volume 3 Issue 2 - www.scireslit.com Page -0021
International Journal of Clinical Cardiology & Research Table 2: Demographic data of the studied groups. Groups T2DM without CVD (n = 120) Statistical test T2DM with CVD (n = 120) Parameters P - value Controls (n = 120) F t Age (years) Mean ± SD Range Height (cm) Mean ± SD Range Weight(Kg) Mean ± SD Range BMI (kg/m2) Mean ± SD Range WC (cm) Mean ± SD Range Systolic BP (mmHg) Mean ± SD Range Diastolylic BP (mmHg) Mean ± SD Range Heart rate (b/min) Mean ± SD Range Duration DM (years) Mean ± SD Range Duration HTN (years) Mean ± SD Range Duration CVD (years) Mean ± SD Range P (*, #: signifi cant at p ≤ 0.05); *: T2DM with CVD & T2DM without CVD versus control group, #: compares T2DM without CVD versus T2DM with CVD. 58.2 ± 7.2 (48-73) 59.1 ± 7.3 (46-70) 57.6 ± 11.2 (20-79) 0.949 0.388 172.6 ± 7.5 (155-191) 173.3 ± 8.7 (150-195) 166.3 ± 8.7$# (140-190) 25.885 < 0.001* 87 ± 12.6 (61-113) 88.5 ± 14.4 (53-135) 81 ± 13.6 (51-127) 10.451 < 0.001* 29.2 ± 3.6 (20.9-39.1) 29.5 ± 4.6 (19.5-42.7) 29.4 ± 5.2 (17.9-43.4) 0.172 0.842 80 ± 9.4 (61.1-110) 87.6 ± 10.5$ (69.3-118.4) 109.7 ± 14.6$# (72-149) 209.210 < 0.001* 121 ± 8.3 (105-140) 128.9 ± 23.1$ (95-190) 131.5 ± 20.8$# (90-180) 10.421 < 0.001* 79.3 ± 4.4 (70-85) 82.3 ± 9.3$ (65-100) 75.6 ± 11.2$# (50-104) 17.404 < 0.001* 73.5 ± 7.2 (60-90) 79.2 ± 7.7$ (60-100) 77.5 ± 14$ (35-117) 10.009 < 0.001* 7.1 ± 5.8 (1-25) 10.4 ± 5.6 (2-25) 4.471 < 0.001* 7.0 ± 4.6 (1-19) 9.0 ± 4.9 (1-20) 2.025 0.042 7.9 ± 4.9 (1-20) ally active hormone and an inactive amino terminal pro-BNP1-76 (NT-pro-BNP-76) [22]. Corin and furin were identifi ed as the most likely pro- BNP processing enzymes [23]. To date, despite numerous studies devoted to the assessment of the clinical signifi cance of pro- BNP-derived peptides, the clinical importance of corin and furin in the pathophysiology of CVDs remains incompletely understood. accelerated plasma corin degradation or clearance [24]. In the current study, there was a signifi cant negative correlation between corin and BNP levels in T2DM patients with or without CVD. Furthermore, a negative correlation was found between corin and furin levels in T2DM patients with CVD. It has been previously reported that plasma corin levels were reduced signifi cantly in patients with HF and that the reduction of corin levels appeared to correlate with the severity of HF [25, 26]. Th ese results are consistent with the elevated levels of unprocessed natriuretic peptides in patients with HF, suggesting that corin defi ciency may be a contributing factor in failing hearts [27]. Recently, low serum corin levels were found to be an independent predictor for poor clinical outcomes in patients with coronary disease [28]. Interestingly, it has been recently demonstrated that there were no signifi cant diff erences in the plasma corin concentration/activity among the acute decom- pensated heart failure (ADHF), non-cardiac dyspnea (non- ADHF), and CHF patient groups. Additionally, there was no signifi cant correlation between corin concentration/activity and pro-BNP, NT-pro-BNP or BNP levels [29]. We hypothesized that corin and furin might serve as biomarkers to predict the development of CVDs in T2DM patients. To test this hypothesis, we measured plasma corin and furin in T2DM patients with or without CVDs as well as in healthy subjects. Th e present study shows that corin levels were signifi cantly lower in T2DM patients with or without CVDs than those in healthy subjects. Similarly, corin levels were lower in T2DM patients with CVDs than those in T2DM patients without CVDs. Th ese results suggest that the reduction of corin levels may be related more closely to the pathological changes associated with DM than that of CVDs. Th e reduced levels of corin observed in T2DM patients with CVDs are likely to refl ect either the chronic loss of cardiomyocytes and/or diminished cardiac corin protein expression. It is possible that the expression/activity of corin sheddase, which remains unknown, is reduced in CVDs, leading to low levels of plasma corin. Alternatively, corin cleaves itself on the cell surface and in CVDs such a process is inhibited or impaired, resulting in lower corin levels in plasma. Other possibilities may also include Surprisingly, it has been reported that the furin-mediated cleavage of pro-BNP resulted in BNP1-32, whereas corin- mediated processing of pro-BNP results in the formation of truncated BNP4- 32, suggesting that corin is unlikely to be the primary candidate for the role of pro-BNP processing enzyme [23][30]. SCIRES Literature - Volume 3 Issue 2 - www.scireslit.com Page -0022
International Journal of Clinical Cardiology & Research Table 3: Biochemical parameters of the studied groups. Groups Parameters F P - value Controls (n = 120) T2DM without CVD (n = 120) T2DM with CVD (n = 120) Corin (ng/ l) Mean ± SD Range 138.8 ± 72.4 (5.9-355) 81.2 ± 60.1$ (7-262) 63.5 ± 40.9$ (18-245) 53.069 < 0.00* Furin (pg/ l) Mean ± SD Range 161.4 ± 37 (100-257) 200.8 ± 85.7 (93-540) 1092.3 ± 819.7$# (107.1-3158.4) 146.580 < 0.00* Hb (g/ dl) Mean ± SD Range 13.3 ± 1.7 (10.5-16.7) 12.3 ±1.9$ (9.1-16.4) 11.6 ± 1.4$# (8-16.9) 28.554 < 0.00* FBS (mg/ dl) Mean ± SD Range 84.1 ± 9.1 (66-113) 166.1 ± 55.1$ (101-378) 199.5 ± 73.5$# (75-482) 148.990 < 0.00* Creatinine (mg/ dl) Mean ± SD Range 0.74 ± 0.22 (0.28-1.11) 1 ± 0.32$ (0.28-1.94) 1.22 ± 0.46$# (0.27-2.3) 57.826 < 0.00* Uric Acid (mg/ dl) Mean ± SD Range 4.3 ± 0.8 (3-6.5) 5 ± 1.1$ (3.3-9.4) 5.6 ± 2.4$# (2.3-12.9) 20.437 < 0.00* Cholesterol Mean ± SD Range 159.4 ± 24.9 (99-213) 188.9 ± 47.6$ (89-336) 208 ± 55.5$# (117-378) 36.139 < 0.00* TG (mg/ dl) Mean ± SD Range 144.1 ± 66.6 (79-424) 174.2 ± 67.4$ (72-411) 234 ± 94$# (93-501) 42.337 < 0.00* HDL-C (mg/ dl) Mean ± SD Range 45.4 ± 9.3 (27-66) 37.7 ± 7.9$ (23-53) 33.9 ± 7.9$# (17-56) 58.848 < 0.00* LDL-C (mg/ dl) Mean ± SD Range 85.2 ± 35.6 (17-192) 116.5 ± 47$ (17-256) 126.9 ± 53$ (52-291) 27.084 < 0.00* CK (U/ L) Mean ± SD Range 86.2 ± 22 (55-167) 119.6 ± 47.7 (41-207) 353.2 ± 473.1$# (40-2212) 33.629 < 0.00* CK-MB (U/ L) Mean ± SD Range 8.9 ± 2.5 (2.8-17.3) 12.3 ± 4.4 (4.7-28.1) 57.6 ± 94.8$# (7.4-418) 29.567 < 0.00* LDH (U/L) Mean ± SD Range 314.9 ± 67 (218-529) 355.3 ± 89.2 (233-612) 576.3 ± 442.3$# (213-1976) 34.272 < 0.00* P (*, #: signifi cant at p ≤ 0.05); *: T2DM with CVD & T2DM without CVD versus control group, #: compares T2DM without CVD versus T2DM with CVD. Table 4: Correlation between serum corin level and studied parameters among study population. Heart rate (b/ min) -0.105 0.048* Furin (pg/ l) -0.349 < 0.001* Serum corin level (ng/ml) Pearson correlation (r) Hb (g/ dl) 0.277 < 0.001* Parameters P - value FBS (mg/ dl) -0.441 < 0.001* Creatinine (mg/ dl) -0.358 < 0.001* Age (years) 0.038 0.474 Uric Acid (mg/ dl) -0.153 < 0.001* Height (cm) 0.126 0.017* Cholesterol (mg/ dl) -0.192 <0.001* Weight(Kg) 0.053 0.319 TG (mg/ dl) -0.267 < 0.001* HDL-C (mg/ dl) 0.221 < 0.001* BMI (kg/ m2) -0.031 0.564 LDL-C (mg/ dl) -0.189 < 0.001* duration Heart disease (years) 0.004 0.968 CK (U/ L) -0.176 < 0.001* Duration DM (years) -0.087 0.178 CK-MB (U/ L) -0.190 < 0.001* DurationHTN (years) -0.141 0.113 LDH (U/ L) -0.187 < 0.001* Systolic BP (mmHg) -0.160 0.002* *P - value signifi cant at P ≤ 0.05. Diastolylic BP (mmHg) 0.018 0.734 SCIRES Literature - Volume 3 Issue 2 - www.scireslit.com Page -0023
International Journal of Clinical Cardiology & Research In the present study, furin levels appeared to be signifi cantly higher in T2DM patients with CVDs than those in T2DM patients without CVDs and healthy subjects. In addition, furin levels were higher in T2DM patients without CVDs than those in healthy subjects. Th ese results suggest that the elevation of furin levels may be related more closely to the pathological changes associated with CVDs than that of DM. Furthermore, there was a signifi cant positive correlation between furin and BNP levels in healthy subjects, T2DM patients with or without CVDs. Moreover, a negative correlation was found between furin and corin levels in T2DM patients with CVDs. In our study, the sensitivity of CVDs diagnosis in T2DM patients by furin level was signifi cantly higher than that by corin. However, both furin and BNP have a similar sensitivity in diagnosing CVDs. Furthermore, the specifi city of CVDs diagnosis by furin level was signifi cantly higher than that by corin. In the current study, since furin produced a similar sensitivity to BNP and better specifi city, PPV, NPV, diagnostic accuracy and AUC than BNP in the biochemical diagnosis of CVDs, furin measurements could add important information to clinical judgment in establishing a fi nal diagnosis of CVDs. Likelihood of altering protein function. However, it may be argued that a more comprehensive examination of the total allelic variation of the corin locus in more diverse populations using a haplotype-based approach will yield additional insights In conclusion, to the best of our knowledge, the present study is the fi rst to provide a preliminary elucidation of the clinical value of the furin levels in the risk assessment of CVDs in T2DM patients. Our fi ndings indicate that a routine measurement of furin levels can improve the predictive ability of CVDs in T2DM patients. Our fi ndings are expected to encourage designing future studies with larger cohorts of patients from diff erent ethnic populations. Further studies are warranted to determine if plasma furin levels are changed in patients with cardiovascular complications over a longer period following medical treatment and if the changes correlate with the underlying pathology. Such studies shall help to understand the diagnostic and prognostic values of furin and may also help to translate basic discoveries in furin research into novel strategies to treat cardiovascular complications. Recently, [29] reported that there were no signifi cant diff erences in the plasma furin concentration among the ADHF, non-ADHF and CHF patient groups. Furthermore, there was no signifi cant correlation between plasma furin concentration and pro-BNP, NT- pro-BNP or BNP levels. Table 5: Correlation between serum corin level and studied parameters among study population. Serum furin level (Pg/ml) Parameters Pearson correlation (r) P - value Age (years) -0.029 0.584 Height (cm) -0.273 0.000* Weight(Kg) -0.155 0.003* BMI (kg/m2) 0.029 0.581 duration Heart disease (years) -0.023 0.801 Duration DM (years) 0.177 0.006* DurationHTN (years) 0.169 0.057 Systolic BP (mmHg) 0.119 0.023* Diastolylic BP (mmHg) -0.128 0.015* Heart rate (b/min) 0.060 0.257 Hb (g/dl) -0.188 < 0.001* FBS (mg/dl) 0.490 < 0.001* Creatinine (mg/dl) 0.485 < 0.001* Uric Acid (mg/dl) 0.293 < 0.001* Cholesterol (mg/dl) 0.309 < 0.001* TG (mg/dl) 0.341 < 0.001* HDL-C (mg/dl) -0.224 < 0.001* LDL-C (mg/dl) 0.238 < 0.001* CK (U/L) 0.336 < 0.001* CK-MB (U/L) 0.307 < 0.001* LDH (U/L) 0.269 < 0.001* Figure 1: Receiver Operating Characteristic Curve (ROC) to diagnostic CVDs *P - value signifi cant at P ≤ 0.05 Table 6: Youden index cut-off points, sensitivity, specifi city, positive pre dictive value, negative predictive value and area under the curve of furin, corin and for diagnostic CVDs in T2DM patients. Cut-off point Sensitivity Specifi city Biomarker with CVDs Accuracy P - value (n = 120) (n = 120) (95% CI) without T2DM T2DM CVDs AUC NPV PPV (%) (%) (%) (%) (%) 111 33 ≤ 353.95 Furin (pg/ ml) 72.5 92.5 90.6 77.1 82.5 0.883 < 0.001* 9 87 > 353.95 (0.836-0.930) 33 56 ≤ 68.2 Corin (ng/ ml) 46.7 72.5 62.9 57.6 59.6 0.578 0.036* (0.505-0.651) 87 64 > 68.2 SCIRES Literature - Volume 3 Issue 2 - www.scireslit.com Page -0024
International Journal of Clinical Cardiology & Research ACKNOWLEDGEMENT Th e authors would like to acknowledge the Palestinian Ministry of Health for their assistance in sample collection. FUNDING Th e present study was partial supported by the Qatar Charity under the Ibhath project for research grants, which is funded by the Cooperation Council for the Arab States of the Gulf through the Islamic Development Bank. REFERENCES 15. Wu Q, Xu-Cai YO, Chen S, Wang W. Corin: new insights into the natriuretic peptide system. Kidney Int. 2009; 75: 142-146. http://bit.ly/2QxmxpW 16. Creemers JW, Khatib AM. Knock-out mouse models of proprotein convertases: unique functions or redundancy, Front Biosci. 2008; 13: 4960- 4971. http://bit.ly/37jU8JT 17. Ichiki T, Boerrigter G, Huntley BK, Sangaralingham SJ, McKie PM, Harty GJ, et al. Diff erential expression of the pro-natriuretic peptide convertases corin and furin in experimental heart failure and atrial fi brosis, Am J Physiol Regul Integr Comp Physiol. 2013; 304: R102-109. http://bit.ly/2On6J6m 18. Zhou Y, Wu Q.Corin in natriuretic peptide processing and hypertension. Curr Hypertens Rep. 2014; 16: 415. http://bit.ly/2KA28g5 19. McMurray JJ, Adamopoulos S, Anker SD, Auricchio A, Bohm M, Dickstein K, et al. ESC Guidelines for the diagnosis and treatment of acute and chronic heart failure 2012: The Task Force for the Diagnosis and Treatment of Acute and Chronic Heart Failure 2012 of the European Society of Cardiology. Developed in collaboration with the Heart Failure Association (HFA) of the ESC. Eur Heart J. 2012; 33: 1787-847. http://bit.ly/32VvJa4 1. Shaw JE, Sicree RA, Zimmet PZ. Global estimates of the prevalence of diabetes for 2010 and 2030. Diabetes Res Clin Pract. 2010; 87: 4-14. http:// bit.ly/33YQvXO 2. Isomaa B, Almgren P, Tuomi T, Forsen B, Lahti K, Nissen M, Taskinen MR, et al. Cardiovascular morbidity and mortality associated with the metabolic syndrome. Diabetes Care. 2001; 24: 683-689. http://bit.ly/2CVzpxZ 20. Yancy CW, Jessup M, Bozkurt B, Butler J, Casey DE Jr, Drazner MH, et al. 2013 ACCF/AHA guideline for the management of heart failure: a report of the American College of Cardiology Foundation/American Heart Association Task Force on Practice Guidelines. J Am Coll Cardiol. 2013; 62: e147-239. http://bit.ly/343kU75 3. Zarrouk M, Franzen S, Acosta S, Nilsson P, Miftaraj M, Eliasson B, et al. Long-term survival and cardiovascular morbidity after elective open aortic aneurysm repair in patients with and without type 2 diabetes: a nationwide propensity-adjusted analysis. Ann Vasc Surg. 2019; 59: 110-118. http://bit. ly/2qhTfkv 21. McCullough PA, Omland T, Maisel AS.B-type natriuretic peptides: a diagnostic breakthrough for clinicians. Rev Cardiovasc Med. 2003; 4: 72-80. http://bit.ly/2OoOqxH 4. Cardiovascular diseases (CVDs). WHO; 2014. http://bit.ly/34bqyo5 5. Fraser ON, Bugnyar T. Ravens reconcile after aggressive confl icts with valuable partners. PLoS One. 2011; 6. http://bit.ly/35dvSqU 22. Daniels LB, Maisel AS. Natriuretic peptides, J Am Coll Cardiol. 2007; 50: 2357-2368. http://bit.ly/2OtPMaf 6. Feygina EE, Artemieva MM, Postnikov AB, Tamm NN, Bloshchitsyna MN, Medvedeva NA, et al. Detection of neprilysin-derived bnp fragments in the circulation: possible insights for targeted neprilysin inhibition therapy for heart failure. Clin Chem. 2019; 65: 1239-1247. http://bit.ly/2QzJKYj 23. Semenov AG, Tamm NN, Seferian KR, Postnikov AB, Karpova NS, Serebryanaya DV, et al. Processing of pro–B-type natriuretic peptide: furin and corin as candidate convertases. Clin Chem. 2010; 56: 1166-1176. http:// bit.ly/2CZdvK9 7. Motiwala SR, Januzzi JL Jr.The role of natriuretic peptides as biomarkers for guiding the management of chronic heart failure. Clin Pharmacol Ther. 2013; 93: 57-67. http://bit.ly/2QARIAz 24. Chen S, Sen S, Young D, Wang W, Moravec CS, Wu Q. Protease corin expression and activity in failing hearts. Am J Physiol Heart Circ Physiol. 2010; 299: H1687-H1692. https://bit.ly/2QxtpDK 8. Dries DL. Relevance of molecular forms of brain natriuretic peptide for natriuretic peptide research. Hypertension. 2007; 49: 971-973. http://bit. ly/37iFpPb 25. Dong N, Chen S, Yang J, He L, Liu P, Zheng D, et al. Plasma soluble corin in patients with heart failure. Circ Heart Fail. 2010; 3: 207-211. https://bit. ly/2CYpYhe 9. Mizyed HAS. Serum corin and furin levels among hypertensive male adult patients in middle governorate-gaza strip. 2017. http://bit.ly/331jVTy 26. Ibebuogu UN, Gladysheva IP, Houng AK, Reed GL. Decompensated Heart Failure Is Associated With Reduced Corin Levels and Decreased Cleavage of Pro-Atrial Natriuretic Peptide. Circ Heart Fail. 2011; 4: 114-120. https://bit. ly/2OsTeC6 10. Ichiki T, Huntley BK, Heublein DM, Sandberg SM, McKie PM, Martin FL, et al. Corin is present in the normal human heart, kidney, and blood, with pro–B- type natriuretic peptide processing in the circulation. Clin Chem. 2011; 57: 40-47. http://bit.ly/37kW3xV 27. Dong N, Chen S, Wang W, Zhou Y, Wu Q. Corin in clinical laboratory diagnostics, ClinicaChimica Acta. 2012; 413: 378-383. https://bit.ly/2CVPFPt 11. Sawada Y, Suda M, Yokoyama H, Kanda T, Sakamaki T, Tanaka S, Nagai R, et al. Stretch-induced hypertrophic growth of cardiocytes and processing of brain-type natriuretic peptide are controlled by proprotein-processing endoprotease furin. J Biol Chem. 1997; 272: 20545-20554. http://bit. ly/2KA0N8R 28. Peleg A, Ghanim D, Vered S, Hasin Y. Serum corin is reduced and predicts adverse outcome in non-ST-elevation acute coronary syndrome. Eur Heart J Acute Cardiovasc Care. 2013; 2: 159-165. https://bit.ly/2CV5qWP 29. Vodovar N, Séronde MF, Laribi S, Gayat E, Lassus J, Januzzi JL Jr, et al. Elevated plasma B-type natriuretic peptide concentrations directly inhibit circulating neprilysin activity in heart failure. JACC Heart Fail. 2015; 3: 629- 636. https://bit.ly/2Xqg0yL 12. Wu F, Yan W, Pan J, Morser J, Wu Q. Processing of pro-atrial natriuretic peptide by corin in cardiac myocytes.J Biol Chem. 2002; 277: 16900-16905. http://bit.ly/35haVeQ 30. Semenov AG, Seferian KR. Biochemistry of the human B-type natriuretic peptide precursor and molecular aspects of its processing. Clin Chim Acta. 2011; 412: 850-860. https://bit.ly/2QyQKoC 13. Ichiki T, Huntley BK, Burnett JC Jr.BNP molecular forms and processing by the cardiac serine protease corin. Adv Clin Chem. 2013; 61: 1-31. http://bit. ly/32X53Wp 14. Hooper JD, Scarman AL, Clarke BE, Normyle JF, Antalis TM.Localization of the mosaic transmembrane serine protease corin to heart myocytes.Eur J Biochem. 2000; 267: 6931-6937. http://bit.ly/2qvi10v SCIRES Literature - Volume 3 Issue 2 - www.scireslit.com Page -0025