Download
1 / 27
901 likes | 2.45k Views
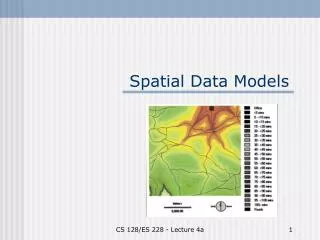
Spatial Data Models. Raster uses individual cells in a matrix, or grid, format to represent real world entities Vector uses coordinates to store the shape of spatial data objects. Raster Data Model. In the raster data model, the primary data object is the cell or pixel

E N D
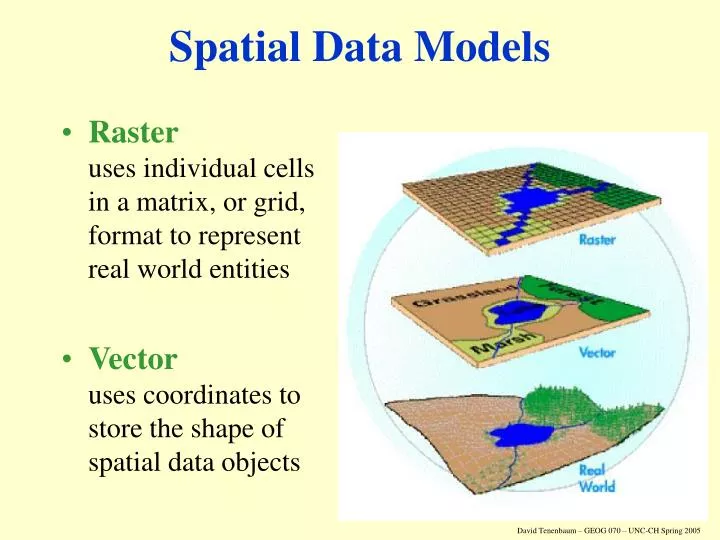
Spatial Data Models • Rasteruses individual cells in a matrix, or grid, format to represent real world entities • Vectoruses coordinates to store the shape of spatial data objects
Raster Data Model • In the raster data model, the primary data object is the cell or pixel • You are familiar with these if you have used a digital camera or viewed a computer monitor
Raster Data Model Cell (x,y) Cell value rows Cell size = resolution columns • The raster data model represents the Earth’s surface as an array of two-dimensional grid cells, with each cell having an associated value:
Raster Data Model • Each grid cell in a raster data layer is one unit (the minimum amount of information in the raster data model) • Every cell has a value, even if it is a special value to indicate that there is “no data” or that data is “missing” at that location • The values are numbers, either: • absolute valuesOR • codes representing an attribute
Cells - Absolute Values • In this instance, the value of the cell is actually the value of the phenomenon of interest, e.g. elevation data (whether floating point or integer):
Cells - Coded Values • Here, the values stored in each cell are used as substitutes for some nominal or categorical data, e.g. land cover classes:
MODIS LULC In Climate Divisions Maryland CD6 North Carolina CD3
Cells – Coded Values • The coded values can then link to one (or more) attribute tables that associate the cell values with various themes or attributes:
Cell Size & Resolution 1 m Resolution 10 m Resolution 5 m Resolution • The size of the cells in the raster data model determines the resolution at which features can be represented • The selected resolution can have an effect on how features are represented:
Raster Data Model - Objects • The raster data model still represents spatial objects, but does so differently from the vector model: • Geographic Primitives • Points • 0 dimensional • Lines • 1 dimensional • Polygons • 2 dimensional
Raster Data Model - Points 1 point = 1 cell • What problems do we have here? • 2 points in a pixel • Point on a border
Raster Data Model - Lines A line = a series of connected cells that portray length • Problems with this representation? • Line may be narrower than pixels show. • e.g. Road layer: how much of a road needs to be in a cell in order to be considered a ‘road’ cell?
Raster Data Model - Areas Area = a group of connected cells that portray a shape • What problems could we have with this representation? • What if a lake’s edge falls in a pixel?
Rules for Assigning Cell Values • Cell values can be assigned to cells accorded to some set of rules, and selecting those rules differently can also effect the representation of features:
Raster and Vector Data Model Comparison • • • Real World Features Raster Vector “A raster model tells what occurs everywhere, while a vector model tells where every thing occurs”
Raster Data Model - Storage • There is a trade-off between spatial resolution and data storage when we use the raster data model, e.g. • 60 km satellite image with 10m cell size • 6000 X 6000 = 36,000,000 cells • 1 byte of attribute value (i.e. values 0-255) • ~36 MB of disk storage! • 60 km satellite image with 100m cell size • 600 x 600 = 360,000 cells • 360 KB of data… 1% the size of the other one
Raster Data Model – Compaction • Because the raster data model records a value for each and every cell in a grid, it is very storage intensive, meaning that it can use a lot of memory and disk space to represent a theme • Compaction techniques are used in conjunction with raster data to reduce the amount of required storage space to a more manageable amount
Raster Data Storage – No Compaction max. cell value 0 0 0 0 0 0 0 0 0 0 0 0 0 0 0 0 0 0 0 0 rows 0 0 0 0 1 1 1 1 0 0 columns 0 0 0 0 1 1 1 1 0 0 0 0 1 1 1 1 1 1 0 0 0 0 1 1 1 1 1 1 0 0 0 0 1 1 1 1 1 1 0 0 0 0 1 1 1 1 1 1 0 0 0 0 0 0 0 0 0 0 0 0 0 0 0 0 0 0 0 0 0 0 This approach represents each cell individually in the file: 10, 10, 1 0 0 0 0 0 0 0 0 0 0 0 0 0 0 0 0 0 0 0 0 0 0 0 0 1 1 1 1 0 0 0 0 0 0 1 1 1 1 0 0 0 0 1 1 1 1 1 1 0 0 0 0 1 1 1 1 1 1 0 0 0 0 1 1 1 1 1 1 0 0 0 0 1 1 1 1 1 1 0 0 0 0 0 0 0 0 0 0 0 0 0 0 0 0 0 0 0 0 0 0 Problem: too much redundancy 103 values
Raster Data Storage – Run Length Encoding 0 0 0 0 0 0 0 0 0 0 0 0 0 0 0 0 0 0 0 0 0 0 0 0 1 1 1 1 0 0 header 0 0 0 0 1 1 1 1 0 0 0 0 1 1 1 1 1 1 0 0 0 0 1 1 1 1 1 1 0 0 0 0 1 1 1 1 1 1 0 0 0 0 1 1 1 1 1 1 0 0 0 0 0 0 0 0 0 0 0 0 row by row 0 0 0 0 0 0 0 0 0 0 This approach takes advantage of patterns in the data, taking advantage of the repetition of values in a row: 10,10,1 0, 10 0, 10 0, 4, 1, 4, 0,2 0, 4, 1, 4, 0,2 0, 2, 1, 6, 0,2 0, 2, 1, 6, 0,2 0, 2, 1, 6, 0,2 0, 2, 1, 6, 0,2 0, 10 0, 10 45 values There is a tendency towards spatial autocorrelation; for nearby cells to have similar values - values often occur in runs across several cells
Data Compression Models (Cont.) 1 1 2 2 1 1 2 2 3 3 2 2 3 3 3 3 ROOT NW NE SE SW 1 3 2 3 3 2 2 • Quadtrees • Recursively divides an area into four quadrants until all the quadrants (at all levels) are homogeneous
Vector to Raster Transformations • Quite often, data in the vector and raster models need to be used together • One dataset is generally transformed to be represented in the other model, introducing distortion.
Vector Data Model - Advantages • It is a good representation of the world as we see it (our visual systems automatically segments the world we see by identifying objects) • The topology of a layer can be fully described and explicitly stored • It is efficient in terms of data storage • It only uses storage for objects of interest and does not need to store values for the spaces in between • No jaggy edges (raster has these on any diagonal) • Useful for network analysis and modeling flows of linear features
Vector Data Model - Disadvantages • The data structure is more complex • especially when you have fully encoded topology (i.e. using the arc-node model) • It is more difficult to write computer programs to manipulate data • Spatial analysis operations can be more difficult
Raster Data Model - Advantages • The data structure is much simpler • It is easy to overlay and combine layers • This model better represents continuous data • Raster data is easily integrated with satellite (and other remotely-sensed) data • Writing programs to manipulate raster is easier • It is easy to do simulation modeling due to uniform size and shape of grids (i.e. it is easy to define uniform modeling units)
Raster Data Model - Disadvantages • Because a value must be stored for each and every cell in a grid, there is a great deal of redundancy and large storage requirements • Location can be captured only as accurately as the resolution allows, which is determined by the cell size • Spatial analyses that are based on topological relationships are not well supported by this model
Which Data Model Should You Use? • This can depend upon the type of data you’re using and what goals you’re trying to achieve • Vector model: linear features such as rivers, roads, political boundaries • Raster model: temperature, elevation (continuous), satellite imagery • Usually your choice is determined by data availability