Download
1 / 73
740 likes | 746 Views
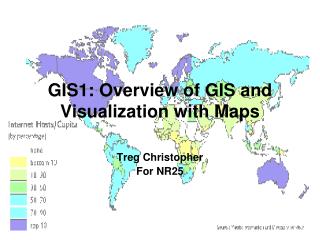
Making Maps With GIS. Getting Started with GIS Chapter 7. Making Maps With GIS. 7.1 The Parts of a Map 7.2 Choosing a Map Type 7.3 Designing the Map. What is a map?.

E N D
Making Maps With GIS Getting Started with GIS Chapter 7
Making Maps With GIS 7.1 The Parts of a Map 7.2 Choosing a Map Type 7.3 Designing the Map
What is a map? • “A graphic depiction of all or part of a geographic realm in which the real-world features have been replaced by symbols in their correct spatial location at a reduced scale.” power line
Map function in GIS • Storage • Temporary communication • Intermediate check of data • Final report • To be effective, must be correctly designed and constructed.
The medium is the message Paper Film Mylar Monitor Projection Broadcast TV THE DISPLAY IS PART OF THE SYMBOLIZATION
Cartographic Elements • Medium • Figure • Ground • Reference information
Cartographic Elements (2) • Border • Neatline • Insets • Scale up • Scale down • Metadata e.g. index • Off-map references
Cartographic Elements (3) • Page coordinates • Ground elements • Graticule/Grid • North arrow
Cartographic Elements (4) • Figure • Point/Line/Area symbols • Text • Place Names • Title
Cartographic Elements (5) • Reference Information • Scale • Projection(s) • Sources (2) • Credits • Legend • Reliability
Map “impact”: Your preference? • A. Distribution of Employment by State 1996 • B. USA: Employment Distribution 1996 • C. U.S. Employment: 1996 Distribution • D. America at Work • E. Where the Jobs are Today
Choosing Elements • Map research • Map compilation • Worksheet • Selection • Placement • Layout • Tools in GIS not ideal
ArcGIS Map Layout a. Love it, it does everything I want. e. Drives me insane, never use it.
Choosing a Map Type • Cartographers have designed hundreds of map types: methods of cartographic representation. • Not all GISs allow all types. • Most have a set of basic types • Depends heavily on the dimension of the data to be shown in the map figure.
Choosing the Wrong Type • Fairly common GIS error. • Due to lack of knowledge about cartographic options. • Can still have perfect symbolization. • Possibility of misinformation • Definite reduction in communication effectiveness.
Map Types: Point Data • Reference • Topographic • Dot • Picture Symbol • Graduated Symbol
Map Types: Line Data • Network • Flow • Isopleth • Reference
Origin of Flow Maps Harness, H. D. (1837). Atlas to Accompany the Second Report of the Railway Commissioners, Ireland. Dublin: Irish Railway Commission.
Map Types: Area Data • Choropleth • Area qualitative • Stepped surface • Hypsometric • Dasymetric • Reference
Map Types: Volume Data • [Isopleth, Stepped Surface, Hypsometric] • Gridded fishnet • Realistic perspective • Hill-shaded • Image map
Isoline Map Lines join points with equal value Often point to raster: interpolated Common routines are splines and IDW Kriging also useful TIN often created as intermediate
Fishnet or Gridded Perspective View Lines on X, Y axis with hidden Line elimination Also possible to use lines at 90 deg to line of sight Many variants Can use anaglyphic stereo
Map Types: Time • Multiple views • Animation • Moving map • Fly thru • Fly by
Cartographic Animations http://www.ncgia.ucsb.edu/projects/gig/v2/About/abImages/apps/sb_growth.gif http://www.aaronkoblin.com/work/faa/us.html
Spatialization: SOM Skupin, A. (2002) A Cartographic Approach to Visualizing Conference Abstracts. IEEE Computer Graphics and Applications. 22 (1): 50 - 58.
Choosing Types • Check the data • Continuous • Discrete • Accuracy & Precision • Reliability • Dimension (Point, Line, Area, Volume) • Scale of Measurment (Nominal etc.) • GIS capability • May need to supplement GIS software
Data Scaling (Stevens) • Nominal (Name of a place) • Ordinal (Small, med., large town) • Interval (Arbitrary zero e.g. Sea Level) • Ratio (Absolute zero e.g. dollars, densities)
Example: Choropleth Mapping • Data should be AREA (e.g. States) • Data should not suffer from area effect. • Population? • Per capita Income? • Elevation? Temperature? • Boundaries unambiguous. • Areas non-overlapping.
Classification • Equal Interval • Natural groups • N-tiles • Equal or unequal? • Logarithmic? Linear? Discontinuous? • How many classes? • Non-overlapping, distinctive groups.


![Making maps, many maps! [What is GIS?]](https://cdn1.slideserve.com/3592384/making-maps-many-maps-what-is-gis-dt.jpg)