Download
1 / 1
10 likes | 144 Views
wp 4: Real -Time Shake Maps GRSmap a tool for rapid estimation of ground-shaking maps for seismic emergency management in the Campania Region of southern Italy Convertito V. 1 , De Matteis R. 2 , Cantore L. 3 , Caccavale M. 4 , Zollo A. 4 and Iannaccone G. 1

E N D
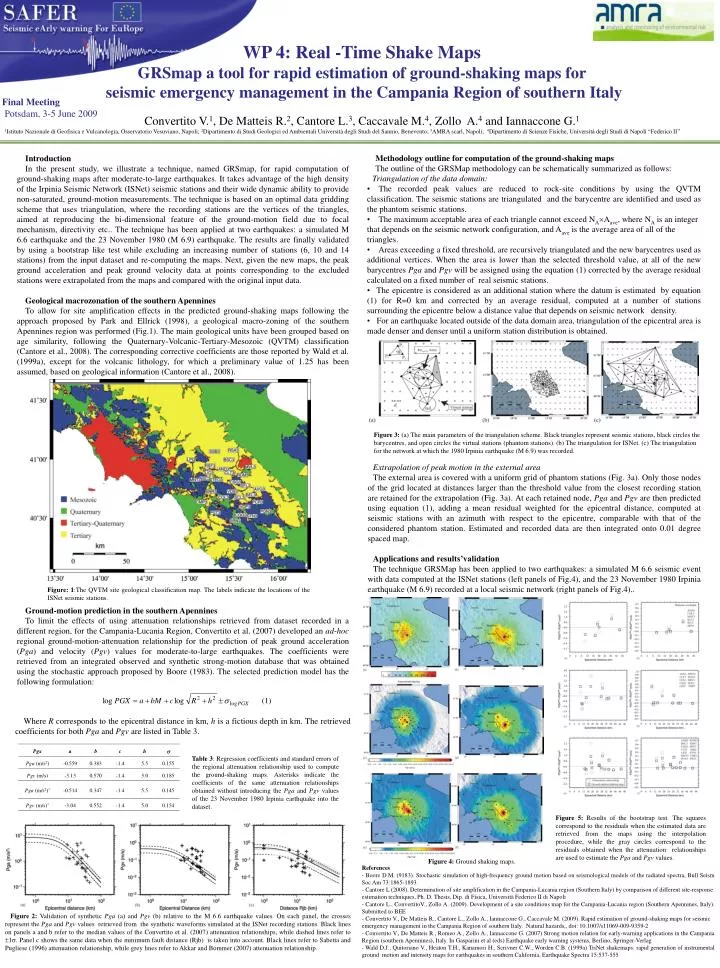
wp4: Real-Time Shake Maps GRSmapa tool for rapid estimation of ground-shaking maps for seismic emergency management in the Campania Region of southern Italy Convertito V.1, De Matteis R.2, Cantore L.3, Caccavale M.4, Zollo A.4 and IannacconeG.1 1Istituto Nazionale di Geofisica e Vulcanologia, Osservatorio Vesuviano, Napoli; 2Dipartimento di Studi Geologici ed Ambientali Università degli Studi del Sannio, Benevento; 3AMRA scarl, Napoli; 4Dipartimento di Scienze Fisiche, Università degli Studi di Napoli “Federico II” Final Meeting Potsdam, 3-5 June 2009 Introduction In the present study, we illustrate a technique, named GRSmap, for rapid computation of ground-shaking maps after moderate-to-large earthquakes. It takes advantage of the high density of the Irpinia Seismic Network (ISNet) seismic stations and their wide dynamic ability to provide non-saturated, ground-motion measurements. The technique is based on an optimal data gridding scheme that uses triangulation, where the recording stations are the vertices of the triangles, aimed at reproducing the bi-dimensional feature of the ground-motion field due to focal mechanism, directivity etc.. The technique has been applied at two earthquakes: a simulated M 6.6 earthquake and the 23 November 1980 (M 6.9) earthquake. The results are finally validated by using a bootstrap like test while excluding an increasing number of stations (6, 10 and 14 stations) from the input dataset and re-computing the maps. Next, given the new maps, the peak ground acceleration and peak ground velocity data at points corresponding to the excluded stations were extrapolated from the maps and compared with the original input data. Geological macrozonation of the southern Apennines To allow for site amplification effects in the predicted ground-shaking maps following the approach proposed by Park and Ellrick (1998), a geological macro-zoning of the southern Apennines region was performed (Fig.1). The main geological units have been grouped based on age similarity, following the Quaternary-Volcanic-Tertiary-Mesozoic (QVTM) classification (Cantore et al., 2008). The corresponding corrective coefficients are those reported by Wald et al. (1999a), except for the volcanic lithology, for which a preliminary value of 1.25 has been assumed, based on geological information (Cantore et al., 2008). • Methodology outline for computation of the ground-shaking maps • The outline of the GRSMap methodology can be schematically summarized as follows: • Triangulation of the data domain: • The recorded peak values are reduced to rock-site conditions by using the QVTM classification. The seismic stations are triangulated and the barycentre are identified and used as the phantom seismic stations. • The maximum acceptable area of each triangle cannot exceed NAAave, where NA is an integer that depends on the seismic network configuration, and Aave is the average area of all of the triangles. • Areas exceeding a fixed threshold, are recursively triangulated and the new barycentres used as additional vertices. When the area is lower than the selected threshold value, at all of the new barycentresPga and Pgv will be assigned using the equation (1) corrected by the average residual calculated on a fixed number of real seismic stations. • The epicentre is considered as an additional station where the datum is estimated by equation (1) for R=0 km and corrected by an average residual, computed at a number of stations surrounding the epicentre below a distance value that depends on seismic network density. • For an earthquake located outside of the data domain area, triangulation of the epicentral area is made denser and denser until a uniform station distribution is obtained. Figure 3: (a) The main parameters of the triangulation scheme. Black triangles represent seismic stations, black circles the barycentres, and open circles the virtual stations (phantom stations). (b) The triangulation for ISNet. (c) The triangulation for the network at which the 1980 Irpinia earthquake (M 6.9) was recorded. Extrapolation of peak motion in the external area The external area is covered with a uniform grid of phantom stations (Fig. 3a). Only those nodes of the grid located at distances larger than the threshold value from the closest recording station are retained for the extrapolation (Fig. 3a). At each retained node, Pga and Pgv are then predicted using equation (1), adding a mean residual weighted for the epicentral distance, computed at seismic stations with an azimuth with respect to the epicentre, comparable with that of the considered phantom station. Estimated and recorded data are then integrated onto 0.01 degree spaced map. Applications and results’validation The technique GRSMap has been applied to two earthquakes: a simulated M 6.6 seismic event with data computed at the ISNet stations (left panels of Fig.4), and the 23 November 1980 Irpinia earthquake (M 6.9) recorded at a local seismic network (right panels of Fig.4).. Figure: 1:The QVTM site geological classification map. The labels indicate the locations of the ISNet seismic stations. Ground-motion prediction in the southern Apennines To limit the effects of using attenuation relationships retrieved from dataset recorded in a different region, for the Campania-Lucania Region, Convertito et al. (2007) developed an ad-hoc regional ground-motion-attenuation relationship for the prediction of peak ground acceleration (Pga) and velocity (Pgv) values for moderate-to-large earthquakes. The coefficients were retrieved from an integrated observed and synthetic strong-motion database that was obtained using the stochastic approach proposed by Boore (1983). The selected prediction model has the following formulation: Where R corresponds to the epicentral distance in km, h is a fictious depth in km. The retrieved coefficients for both Pga and Pgv are listed in Table 3. Table 3: Regression coefficients and standard errors of the regional attenuation relationship used to compute the ground-shaking maps. Asterisks indicate the coefficients of the same attenuation relationships obtained without introducing the Pga and Pgv values of the 23 November 1980 Irpinia earthquake into the dataset. Figure 5: Results of the bootstrap test. The squares correspond to the residuals when the estimated data are retrieved from the maps using the interpolation procedure, while the gray circles correspond to the residuals obtained when the attenuation relationships are used to estimate the Pga and Pgv values. Figure 4: Ground shaking maps. • References • - Boore D.M. (9183). Stochastic simulation of high-frequency ground motion based on seismological models of the radiated spectra, Bull Seism Soc Am 73:1865-1893 • - Cantore L (2008). Determination of site amplification in the Campania-Lucania region (Southern Italy) by comparison of different site-response • estimation techniques, Ph. D. Thesis, Dip. di Fisica, Università Federico II di Napoli • Cantore L., ConvertitoV., Zollo A. (2009). Development of a site conditions map for the Campania-Lucania region (Southern Apennines, Italy). Submitted to BEE • Convertito V., De Matteis R., Cantore L., Zollo A., Iannaccone G., Caccavale M. (2009). Rapid estimation of ground-shaking maps for seismic emergency management in the Campania Region of southern Italy. Natural hazards,, doi: 10.1007/s11069-009-9359-2 • Convertito V., De Matteis R., Romeo A., Zollo A., Iannaccone G. (2007) Strong motion relation for early-warning applications in the Campania Region (southern Apennines), Italy. In Gasparini et al (eds) Earthquake early warning systems, Berlino, Springer-Verlag • Wald D.J., Quitoriano V., Heaton T.H., Kanamori H., Scrivner C.W., Worden C.B. (1999a) TriNet shakemaps: rapid generation of instrumental ground motion and intensity maps for earthquakes in southern California, Earthquake Spectra 15:537-555 Figure 2: Validation of synthetic Pga (a) and Pgv (b) relative to the M 6.6 earthquake values. On each panel, the crosses represent the Pga and Pgv values retrieved from the synthetic waveforms simulated at the ISNet recording stations. Black lines on panels a and b refer to the median values of the Convertito et al. (2007) attenuation relationships, while dashed lines refer to 1. Panel c shows the same data when the minimum fault distance (Rjb) is taken into account. Black lines refer to Sabetta and Pugliese (1996) attenuation relationship, while grey lines refer to Akkar and Bommer (2007) attenuation relationship.