Download
1 / 1
10 likes | 84 Views
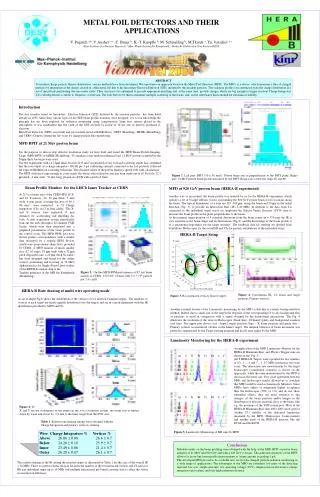
EPS2003. METAL FOIL DETECTORS FOR THE RADIATION AND BEAM POSITION MONITORING. V. Pugatch, Yu. Vassiliev, V. Aushev, N. Tkatch. ABSTRACT

E N D
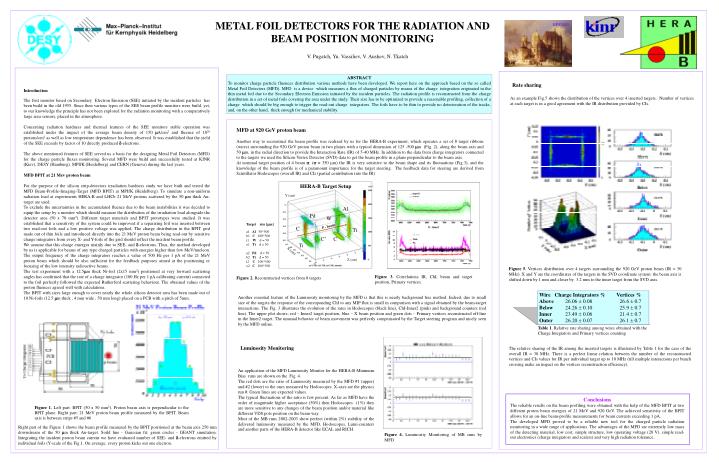
EPS2003 METAL FOIL DETECTORS FOR THE RADIATION AND BEAM POSITION MONITORING V. Pugatch, Yu. Vassiliev, V. Aushev, N. Tkatch ABSTRACT To monitor charge particle fluences distribution various methods have been developed. We report here on the approach based on the so called Metal Foil Detectors (MFD). MFD is a device which measures a flux of charged particles by means of the charge integration originated in the thin metal foil due to the Secondary Electron Emission initiated by the incident particles. The radiation profile is reconstructed from the charge distribution in a set of metal foils covering the area under the study. Their size has to be optimized to provide a reasonable profiling, collection of a charge which should be big enough to trigger the read-out charge integrators. The foils have to be thin to provide no deterioration of the tracks, and, on the other hand, thick enough for mechanical stability. Rate sharing Introduction The first monitor based on Secondary Electron Emission (SEE) initiated by the incident particles has been build in the old 1955. Since then various types of the SEE beam profile monitors were build, yet, to our knowledge the principle has not been explored for the radiation monitoring with a comparatively large area sensors, placed in the atmosphere. Concerning radiation hardness and thermal features of the SEE monitors stable operation was established under the impact of the average beam density of 150 A/cm2 and fluence of 1020 protons/cm2as well as low temperature dependence has been observed. It was established that the yield of the SEE exceeds by factor of 10 directly produced -electrons. The above mentioned features of SEE served us a basis for the designing Metal Foil Detectors (MFD) for the charge particle fluxes monitoring. Several MFD were build and successfully tested at KINR (Kiev), DESY (Hamburg), MPIfK (Heidelberg) and CERN (Geneva) during the last years. MFD BPIT at 21 Mev proton beam For the purpose of the silicon strip-detectors irradiation hardness study we have built and tested the MFD Beam-Profile-Imaging-Target (MFD BPIT) at MPIfK (Heidelberg). To simulate a non-uniform radiation load at experiments HERA-B and LHCb 21 MeV protons scattered by the 50 m thick Au-target are used. To exclude the uncertainties in the accumulated fluence due to the beam instabilities it was decided to equip the setup by a monitor which should measure the distribution of the irradiation load alongside the detector area (50 x 70 mm2). Different target materials and BPIT prototypes were studied. It was established that a sensitivity of the system could be improved if a separating foil was inserted between two read-out foils and a low positive voltage was applied. The charge distribution in the BPIT grid made out of thin foils and introduced directly into the 21 MeV proton beam being read-out by sensitive charge integrators from every X- and Y-foils of the grid should reflect the incident beam profile. We assume that this charge emerges mainly due to SEE- and -electrons. Thus, the method developed by us is applicable for beams of any type charged particles with energies higher than few MeV/nucleon. The output frequency of the charge integrators reaches a value of 500 Hz per 1 pA of the 21 MeV proton beam which should be also sufficient for the feedback purposes aimed at the positioning or focusing of the low intensity radioactive beams. The test experiment with a 12.5m thick Ni-foil (2x15 mm2) positioned at very forward scattering angles has confirmed that the rate of a charge integrator (100 Hz per 1 pA calibrating current) connected to the foil perfectly followed the expected Rutherford scattering behaviour. The obtained values of the proton fluences agreed well with calculations. The BPIT with sizes large enough to cover nearly the whole silicon detector area has been made out of 10 Ni-foils (12.5 m thick , 4 mm wide , 50 mm long) placed on a PCB with a pitch of 5mm. As an example Fig.5 shows the distribution of the vertices over 4 inserted targets. Number of vertices at each target is in a good agreement with the IR distribution provided by CIs. MFD at 920 GeV proton beam Another way to reconstruct the beam profile was realized by us for the HERA-B experiment, which operates a set of 8 target ribbons (wires) surrounding the 920 GeV proton beam in two planes with a typical dimension of 125 -500 m (Fig. 2), along the beam axis and 50 m, in the radial direction to provide the Interaction Rate (IR) of 5-40 MHz. In addition to the data from charge integrators connected to the targets we used the Silicon Vertex Detector (SVD) data to get the beam profile in a plane perpendicular to the beam axis. At nominal target position of 4 beam , ( = 350 m) the IR is very sensitive to the beam shape and its fluctuations (Fig.3), and the knowledge of the beam profile is of a paramount importance for the target steering. The feedback data for steering are derived from Scintillator Hodoscopes (overall IR) and CIs (partial contribution into the IR) HERA-B Target Setup Y (cm) Al Pd W Target size [m] a1 Al 50*500 b1 C 100*500 i1 W d = 50 o1 Ti d = 50 a2 Pd d = 50 b2 Ti d = 50 i2 C 100*500 o2 C 100*500 P - beam C Ti C* C Ti X (cm) Z (cm) Figure 5. Vertices distribution over 4 targets surrounding the 920 GeV proton beam (IR = 30 MHz). X and Y are the coordinates of the targets in the SVD coordinate system: the beam axis is shifted down by 1 mm and closer by 3.2 mm to the inner target from the SVD axis. Figure 3. Correlations IR, ChI, beam and target position, Primary vertices. Figure 2. Reconstructed vertices from 8 targets Wire Charge Integrators % Vertices % Above 26.06 0.08 26.6 0.7 Below 24.26 0.10 25.9 0.7 Inner 23.49 0.06 21.4 0.7 Outer 26.20 0.07 26.1 0.7 Another essential feature of the Luminosity monitoring by the MFD is that this is nearly background free method. Indeed, due to small size of the targets the response of the corresponding ChI to any MIP flux is small in comparison with a signal obtained by the beam-target interactions. The Fig. 3 illustrates the evolution of the rates in Hodoscopes (black line), ChI-Inner2 (pink) and background counters (red line). The upper plot shows: red – Inner2 target position, blue – X beam position and green dots – Primary vertices reconstructed off-line in the Inner2 target. The unusual behavior of beam movement was perfectly compensated by the Target steering program and nicely seen by the MFD online. Table 1. Relative rate sharing among wires obtained with the Charge Integrators and Primary vertices counting Luminosity Monitoring The relative sharing of the IR among the inserted targets is illustrated by Table 1 for the case of the overall IR = 30 MHz. There is a perfect linear relation between the number of the reconstructed vertices and CIs values for IR per individual target up to 10 MHz (till multiple interactions per bunch crossing make an impact on the vertices reconstruction efficiency). An application of the MFD Luminosity Monitor for the HERA-B Minimum Bias runs are shown on the Fig. 4. The red dots are the ratio of Luminosity measured by the MFD #1 (upper) and #2 (lower) to the ones measured by Hodoscopes. X-axes are the physics run #. Green lines are expected values. The typical fluctuations of the ratio is few percent. As far as MFD have the order of magnitude higher acceptance (50%) then Hodoscopes (1%) they are more sensitive to any changes of the beam position and/or material like different VDS pots position on the beam way. Most of the MB runs 2002-2003 show perfect (within 2%) stability of the delivered luminosity measured by the MFD, Hodoscopes, Lumi-counters and another parts of the HERA-B detector like ECAL and RICH. Conclusions The reliable results on the beam profiling were obtained with the help of the MFD BPIT at two different proton beam energies of 21 MeV and 920 GeV. The achieved sensitivity of the BPIT allows for an on-line beam-profile measurements for beam currents exceeding 1 pA. The developed MFD proved to be a reliable new tool for the charged particle radiation monitoring in a wide range of applications. The advantages of the MFD are extremely low mass of the detecting material, low cost, simple structure, low operating voltage (20 V), simple read-out electronics (charge integrators and scalers) and very high radiation tolerance. Figure 1. Left part: BPIT (50 x 50 mm2). Proton beam axis is perpendicular to the BPIT plane. Right part: 21 MeV proton beam profile measured by the BPIT. Beam axis is between strips #5 and #6 Right part of the Figure 1 shows the beam profile measured by the BPIT positioned at the beam axis 250 mm downstream of the 50 m thick Au-target. Soild line - Gaussian fit; green circles - GEANT simulation. Integrating the incident proton beam current we have evaluated number of SEE- and -electrons emitted by individual foils (Y-scale of the Fig.1. On average, every proton kicks out one electron. Figure 4. Luminosity Monitoring of MB runs by MFD