Download
1 / 1
10 likes | 202 Views
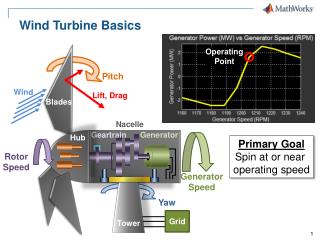
Wind Turbine Design and Implementation. AC Current/Voltage Sensors. Air-X Turbine. Load. DC Current/Voltage Sensors. Inverter. Relay. NI DAQ 6008. Grid. Capacity Sensor Circuit. Battery Bank. Interface. Introduction. Concept Sketch. Abstract

E N D
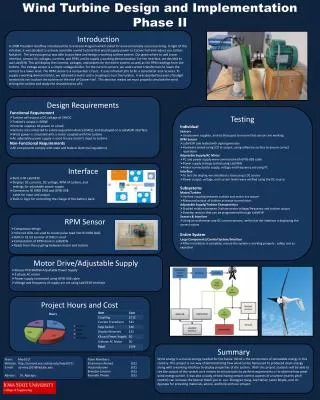
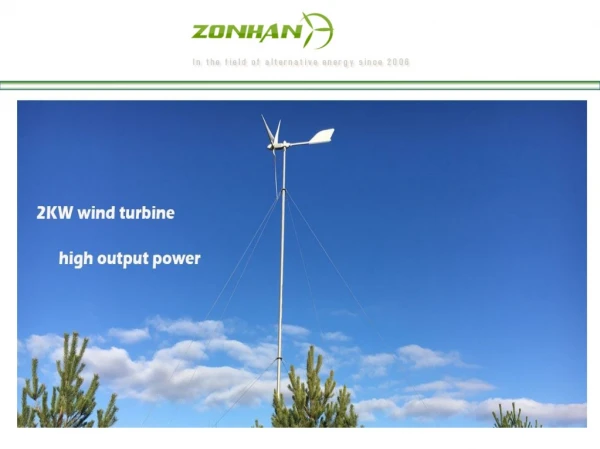
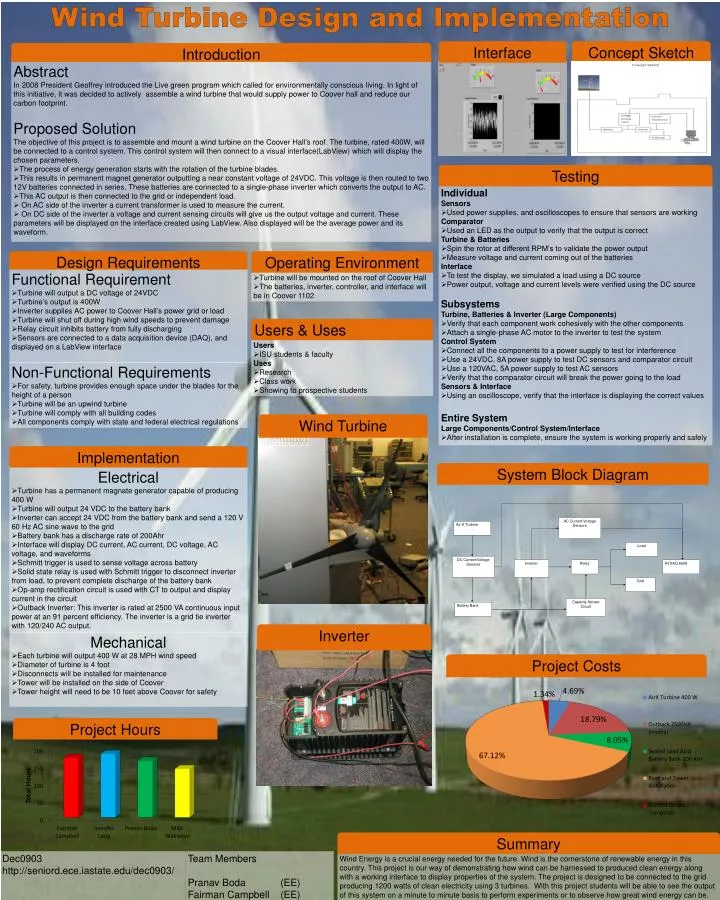
Wind Turbine Design and Implementation AC Current/Voltage Sensors Air-X Turbine Load DC Current/Voltage Sensors Inverter Relay NI DAQ 6008 Grid Capacity Sensor Circuit Battery Bank Interface Introduction Concept Sketch • Abstract • In 2008 President Geoffrey introduced the Live green program which called for environmentally conscious living. In light of this initiative, it was decided to actively assemble a wind turbine that would supply power to Coover hall and reduce our carbon footprint. • Proposed Solution • The objective of this project is to assemble and mount a wind turbine on the Coover Hall’s roof. The turbine, rated 400W, will be connected to a control system. This control system will then connect to a visual interface(LabView) which will display the chosen parameters. • The process of energy generation starts with the rotation of the turbine blades. • This results in permanent magnet generator outputting a near constant voltage of 24VDC. This voltage is then routed to two 12V batteries connected in series. These batteries are connected to a single-phase inverter which converts the output to AC. • This AC output is then connected to the grid or independent load. • On AC side of the inverter a current transformer is used to measure the current. • On DC side of the inverter a voltage and current sensing circuits will give us the output voltage and current. These parameters will be displayed on the interface created using LabView. Also displayed will be the average power and its waveform. Design Requirements Implementation • Electrical • Turbine has a permanent magnate generator capable of producing 400 W • Turbine will output 24 VDC to the battery bank • Inverter can accept 24 VDC from the battery bank and send a 120 V 60 Hz AC sine wave to the grid • Battery bank has a discharge rate of 200Ahr • Interface will display DC current, AC current, DC voltage, AC voltage, and waveforms • Schmitt trigger is used to sense voltage across battery • Solid state relay is used with Schmitt trigger to disconnect inverter from load, to prevent complete discharge of the battery bank • Op-amp rectification circuit is used with CT to output and display current in the circuit • Outback Inverter: This inverter is rated at 2500 VA continuous input power at an 91 percent efficiency. The inverter is a grid tie inverter with 120/240 AC output. • Functional Requirement • Turbine will output a DC voltage of 24VDC • Turbine’s output is 400W • Inverter supplies AC power to Coover Hall’s power grid or load • Turbine will shut off during high wind speeds to prevent damage • Relay circuit inhibits battery from fully discharging • Sensors are connected to a data acquisition device (DAQ), and displayed on a LabViewinterface Testing Wind Turbine • Individual • Sensors • Used power supplies, and oscilloscopes to ensure that sensors are working • Comparator • Used an LED as the output to verify that the output is correct • Turbine & Batteries • Spin the rotor at different RPM’s to validate the power output • Measure voltage and current coming out of the batteries • Interface • To test the display, we simulated a load using a DC source • Power output, voltage and current levels were verified using the DC source • Subsystems • Turbine, Batteries & Inverter (Large Components) • Verify that each component work cohesively with the other components • Attach a single-phase AC motor to the inverter to test the system • Control System • Connect all the components to a power supply to test for interference • Use a 24VDC, 8A power supply to test DC sensors and comparator circuit • Use a 120VAC, 5A power supply to test AC sensors • Verify that the comparator circuit will break the power going to the load • Sensors & Interface • Using an oscilloscope, verify that the interface is displaying the correct values • Entire System • Large Components/Control System/Interface • After installation is complete, ensure the system is working properly and safely • Non-Functional Requirements • For safety, turbine provides enough space under the blades for the height of a person • Turbine will be an upwind turbine • Turbine will comply with all building codes • All components comply with state and federal electrical regulations • Mechanical • Each turbine will output 400 W at 28 MPH wind speed • Diameter of turbine is 4 foot • Disconnects will be installed for maintenance • Tower will be installed on the side of Coover • Tower height will need to be 10 feet above Coover for safety Users & Uses Operating Environment • Turbine will be mounted on the roof of Coover Hall • The batteries, inverter, controller, and interface will be in Coover1102 • Users • ISU students & faculty • Uses • Research • Class work • Showing to prospective students Inverter System Block Diagram Summary Wind Energy is a crucial energy needed for the future. Wind is the cornerstone of renewable energy in this country. This project is our way of demonstrating how wind can be harnessed to produced clean energy along with a working interface to display properties of the system. The project is designed to be connected to the grid producing 1200 watts of clean electricity using 3 turbines. With this project students will be able to see the output of this system on a minute to minute basis to perform experiments or to observe how great wind energy can be. Special thank you to our ZhongjianKang, HongtaoZeng. Lee Harker, Jason Boyde, and Professor Dajifor providing materials, advice, and help with our project. Dec0903 http://seniord.ece.iastate.edu/dec0903/ Client/Advisor Dr. Ajjarapu Team Members Pranav Boda (EE) Fairman Campbell (EE) Jennifer Long (EE) Milki Wakweya (EE)