Download
1 / 91
910 likes | 1.11k Views
Ensemble Data Assimilation and Uncertainty Quantification. Jeffrey Anderson, Alicia Karspeck , Tim Hoar, Nancy Collins, Kevin Raeder, Steve Yeager National Center for Atmospheric Research. What is Data Assimilation?. Observations. Observations combined with a Model forecast….

E N D
Ensemble Data Assimilation and Uncertainty Quantification Ocean Sciences Meeting 24 Feb. 2012 Jeffrey Anderson, Alicia Karspeck, Tim Hoar, Nancy Collins, Kevin Raeder, Steve Yeager National Center for Atmospheric Research
What is Data Assimilation? Observations Observations combined with a Model forecast… …to produce an analysis(best possible estimate). + Ocean Sciences Meeting 24 Feb. 2012
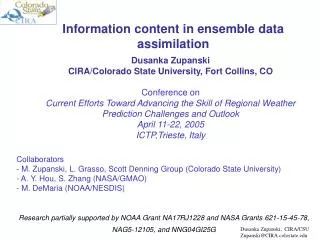
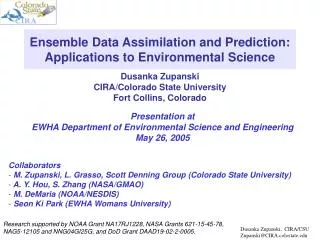
What is Ensemble Data Assimilation? Use an ensemble (set) of model forecasts. Use sample statistics to get covariance between state and observations. Often assume that ensemble members are random draw. Ensemble methods I use are optimal solution when: Model is linear, Observation errors are unbiased gaussian, Relation between model and obs is linear, Ensemble is large enough. Ocean Sciences Meeting 24 Feb. 2012
Atmospheric Ensemble Reanalysis, 1998-2010 Assimilation uses 80 members of 2o FV CAM forced by a single ocean (Hadley+ NCEP-OI2) and produces a very competitive reanalysis. O(1 million) atmospheric obs are assimilated every day. 500 hPa GPH Feb 17 2003 Ocean Sciences Meeting 24 Feb. 2012
Ensemble Filter for Large Geophysical Models 1. Use model to advance ensemble (3 members here) to time at which next observation becomes available. Ensemble state estimate after using previous observation (analysis) Ensemble state at time of next observation (prior) Ocean Sciences Meeting 24 Feb. 2012
Ensemble Filter for Large Geophysical Models 2. Get prior ensemble sample of observation, y = h(x), by applying forward operator h to each ensemble member. Theory: observations from instruments with uncorrelated errors can be done sequentially. Ocean Sciences Meeting 24 Feb. 2012
Ensemble Filter for Large Geophysical Models 3. Get observed value and observational error distribution from observing system. Ocean Sciences Meeting 24 Feb. 2012
Ensemble Filter for Large Geophysical Models 4. Find the increments for the prior observation ensemble (this is a scalar problem for uncorrelated observation errors). Note: Difference between various ensemble filters is primarily in observation increment calculation. Ocean Sciences Meeting 24 Feb. 2012
Ensemble Filter for Large Geophysical Models 5. Use ensemble samples of y and each state variable to linearly regress observation increments onto state variable increments. Theory: impact of observation increments on each state variable can be handled independently! Ocean Sciences Meeting 24 Feb. 2012
Ensemble Filter for Large Geophysical Models 6. When all ensemble members for each state variable are updated, there is a new analysis. Integrate to time of next observation … Ocean Sciences Meeting 24 Feb. 2012
Ensemble Filter for Lorenz-96 40-Variable Model 40 state variables: X1, X2,..., X40. dXi / dt = (Xi+1 - Xi-2)Xi-1 - Xi + F. Acts ‘something’ like synoptic weather around a latitude band. Ocean Sciences Meeting 24 Feb. 2012
Ensemble Filter for Lorenz-96 40-Variable Model 40 state variables: X1, X2,..., X40. dXi / dt = (Xi+1 - Xi-2)Xi-1 - Xi + F. Acts ‘something’ like synoptic weather around a latitude band. Ocean Sciences Meeting 24 Feb. 2012
Ensemble Filter for Lorenz-96 40-Variable Model 40 state variables: X1, X2,..., X40. dXi / dt = (Xi+1 - Xi-2)Xi-1 - Xi + F. Acts ‘something’ like synoptic weather around a latitude band. Ocean Sciences Meeting 24 Feb. 2012
Ensemble Filter for Lorenz-96 40-Variable Model 40 state variables: X1, X2,..., X40. dXi / dt = (Xi+1 - Xi-2)Xi-1 - Xi + F. Acts ‘something’ like synoptic weather around a latitude band. Ocean Sciences Meeting 24 Feb. 2012
Ensemble Filter for Lorenz-96 40-Variable Model 40 state variables: X1, X2,..., X40. dXi / dt = (Xi+1 - Xi-2)Xi-1 - Xi + F. Acts ‘something’ like synoptic weather around a latitude band. Ocean Sciences Meeting 24 Feb. 2012
Ensemble Filter for Lorenz-96 40-Variable Model 40 state variables: X1, X2,..., X40. dXi / dt = (Xi+1 - Xi-2)Xi-1 - Xi + F. Acts ‘something’ like synoptic weather around a latitude band. Ocean Sciences Meeting 24 Feb. 2012
Ensemble Filter for Lorenz-96 40-Variable Model 40 state variables: X1, X2,..., X40. dXi / dt = (Xi+1 - Xi-2)Xi-1 - Xi + F. Acts ‘something’ like synoptic weather around a latitude band. Ocean Sciences Meeting 24 Feb. 2012
Ensemble Filter for Lorenz-96 40-Variable Model 40 state variables: X1, X2,..., X40. dXi / dt = (Xi+1 - Xi-2)Xi-1 - Xi + F. Acts ‘something’ like synoptic weather around a latitude band. Ocean Sciences Meeting 24 Feb. 2012
Ensemble Filter for Lorenz-96 40-Variable Model 40 state variables: X1, X2,..., X40. dXi / dt = (Xi+1 - Xi-2)Xi-1 - Xi + F. Acts ‘something’ like synoptic weather around a latitude band. Ocean Sciences Meeting 24 Feb. 2012
Ensemble Filter for Lorenz-96 40-Variable Model 40 state variables: X1, X2,..., X40. dXi / dt = (Xi+1 - Xi-2)Xi-1 - Xi + F. Acts ‘something’ like synoptic weather around a latitude band. Ocean Sciences Meeting 24 Feb. 2012
Lorenz-96 is sensitive to small perturbations Introduce 20 ‘ensemble’ state estimates. Each is slightly perturbed for each of the 40-variables at time 100. Refer to unperturbed control integration as ‘truth’.. Ocean Sciences Meeting 24 Feb. 2012
Lorenz-96 is sensitive to small perturbations Introduce 20 ‘ensemble’ state estimates. Each is slightly perturbed for each of the 40-variables at time 100. Refer to unperturbed control integration as ‘truth’.. Ocean Sciences Meeting 24 Feb. 2012
Lorenz-96 is sensitive to small perturbations Introduce 20 ‘ensemble’ state estimates. Each is slightly perturbed for each of the 40-variables at time 100. Refer to unperturbed control integration as ‘truth’.. Ocean Sciences Meeting 24 Feb. 2012
Lorenz-96 is sensitive to small perturbations Introduce 20 ‘ensemble’ state estimates. Each is slightly perturbed for each of the 40-variables at time 100. Refer to unperturbed control integration as ‘truth’.. Ocean Sciences Meeting 24 Feb. 2012
Lorenz-96 is sensitive to small perturbations Introduce 20 ‘ensemble’ state estimates. Each is slightly perturbed for each of the 40-variables at time 100. Refer to unperturbed control integration as ‘truth’.. Ocean Sciences Meeting 24 Feb. 2012
Lorenz-96 is sensitive to small perturbations Introduce 20 ‘ensemble’ state estimates. Each is slightly perturbed for each of the 40-variables at time 100. Refer to unperturbed control integration as ‘truth’.. Ocean Sciences Meeting 24 Feb. 2012
Lorenz-96 is sensitive to small perturbations Introduce 20 ‘ensemble’ state estimates. Each is slightly perturbed for each of the 40-variables at time 100. Refer to unperturbed control integration as ‘truth’.. Ocean Sciences Meeting 24 Feb. 2012
Lorenz-96 is sensitive to small perturbations Introduce 20 ‘ensemble’ state estimates. Each is slightly perturbed for each of the 40-variables at time 100. Refer to unperturbed control integration as ‘truth’.. Ocean Sciences Meeting 24 Feb. 2012
Lorenz-96 is sensitive to small perturbations Introduce 20 ‘ensemble’ state estimates. Each is slightly perturbed for each of the 40-variables at time 100. Refer to unperturbed control integration as ‘truth’.. Ocean Sciences Meeting 24 Feb. 2012
Lorenz-96 is sensitive to small perturbations Introduce 20 ‘ensemble’ state estimates. Each is slightly perturbed for each of the 40-variables at time 100. Refer to unperturbed control integration as ‘truth’.. Ocean Sciences Meeting 24 Feb. 2012
Lorenz-96 is sensitive to small perturbations Introduce 20 ‘ensemble’ state estimates. Each is slightly perturbed for each of the 40-variables at time 100. Refer to unperturbed control integration as ‘truth’.. Ocean Sciences Meeting 24 Feb. 2012
Lorenz-96 is sensitive to small perturbations Introduce 20 ‘ensemble’ state estimates. Each is slightly perturbed for each of the 40-variables at time 100. Refer to unperturbed control integration as ‘truth’.. Ocean Sciences Meeting 24 Feb. 2012
Lorenz-96 is sensitive to small perturbations Introduce 20 ‘ensemble’ state estimates. Each is slightly perturbed for each of the 40-variables at time 100. Refer to unperturbed control integration as ‘truth’.. Ocean Sciences Meeting 24 Feb. 2012
Lorenz-96 is sensitive to small perturbations Introduce 20 ‘ensemble’ state estimates. Each is slightly perturbed for each of the 40-variables at time 100. Refer to unperturbed control integration as ‘truth’.. Ocean Sciences Meeting 24 Feb. 2012
Lorenz-96 is sensitive to small perturbations Introduce 20 ‘ensemble’ state estimates. Each is slightly perturbed for each of the 40-variables at time 100. Refer to unperturbed control integration as ‘truth’.. Ocean Sciences Meeting 24 Feb. 2012
Assimilate ‘observations’ from 40 random locations each step. Observations generated by interpolating truth to station location. Simulate observational error: Add random draw from N(0, 16) to each. Start from ‘climatological’ 20-member ensemble. Ocean Sciences Meeting 24 Feb. 2012
Assimilate ‘observations’ from 40 random locations each step. Observations generated by interpolating truth to station location. Simulate observational error: Add random draw from N(0, 16) to each. Start from ‘climatological’ 20-member ensemble. Ocean Sciences Meeting 24 Feb. 2012
Assimilate ‘observations’ from 40 random locations each step. Observations generated by interpolating truth to station location. Simulate observational error: Add random draw from N(0, 16) to each. Start from ‘climatological’ 20-member ensemble. Ocean Sciences Meeting 24 Feb. 2012
Assimilate ‘observations’ from 40 random locations each step. Observations generated by interpolating truth to station location. Simulate observational error: Add random draw from N(0, 16) to each. Start from ‘climatological’ 20-member ensemble. Ocean Sciences Meeting 24 Feb. 2012
Assimilate ‘observations’ from 40 random locations each step. Observations generated by interpolating truth to station location. Simulate observational error: Add random draw from N(0, 16) to each. Start from ‘climatological’ 20-member ensemble. Ocean Sciences Meeting 24 Feb. 2012
Assimilate ‘observations’ from 40 random locations each step. Observations generated by interpolating truth to station location. Simulate observational error: Add random draw from N(0, 16) to each. Start from ‘climatological’ 20-member ensemble. Ocean Sciences Meeting 24 Feb. 2012
Assimilate ‘observations’ from 40 random locations each step. Observations generated by interpolating truth to station location. Simulate observational error: Add random draw from N(0, 16) to each. Start from ‘climatological’ 20-member ensemble. Ocean Sciences Meeting 24 Feb. 2012
Assimilate ‘observations’ from 40 random locations each step. Observations generated by interpolating truth to station location. Simulate observational error: Add random draw from N(0, 16) to each. Start from ‘climatological’ 20-member ensemble. Ocean Sciences Meeting 24 Feb. 2012
Assimilate ‘observations’ from 40 random locations each step. Observations generated by interpolating truth to station location. Simulate observational error: Add random draw from N(0, 16) to each. Start from ‘climatological’ 20-member ensemble. Ocean Sciences Meeting 24 Feb. 2012
Assimilate ‘observations’ from 40 random locations each step. This isn’t working very well. Ensemble spread is reduced, but..., Ensemble is inconsistent with truth most places. Confident and wrong. Confident and right. Ocean Sciences Meeting 24 Feb. 2012
Some Error Sources in Ensemble Filters 3. Observation error 4. Sampling Error; Gaussian Assumption 2. Obs. operator error; Representativeness 5. Sampling Error; Assuming Linear Statistical Relation 1. Model error Ocean Sciences Meeting 24 Feb. 2012
Observations impact unrelated state variables through sampling error. Plot shows expected absolute value of sample correlation vs. true correlation. Unrelated obs. reduce spread, increase error. Attack with localization. Don’t let obs. Impact unrelated state. Ocean Sciences Meeting 24 Feb. 2012
Lorenz-96 Assimilation with localization of observation impact. Ocean Sciences Meeting 24 Feb. 2012
Lorenz-96 Assimilation with localization of observation impact. Ocean Sciences Meeting 24 Feb. 2012
Lorenz-96 Assimilation with localization of observation impact. Ocean Sciences Meeting 24 Feb. 2012