Download
1 / 30
310 likes | 500 Views
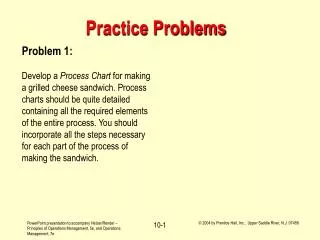
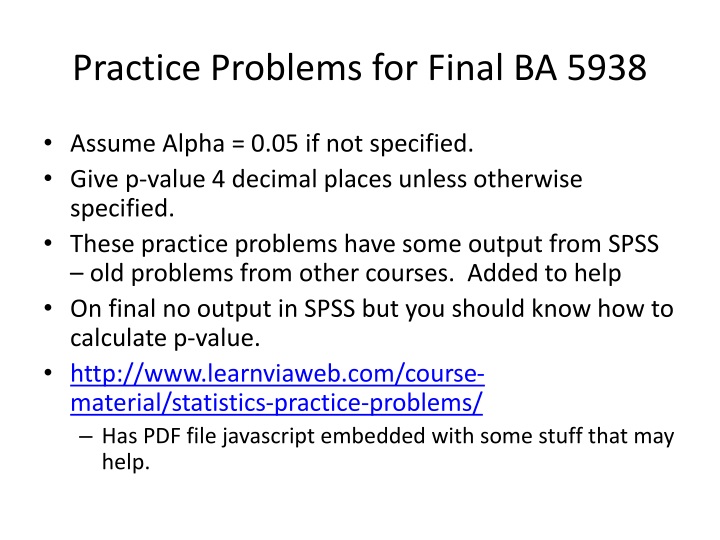
Practice Problems for Final BA 5938. Assume Alpha = 0.05 if not specified. Give p-value 4 decimal places unless otherwise specified. These practice problems have some output from SPSS – old problems from other courses. Added to help

E N D
Practice Problems for Final BA 5938 • Assume Alpha = 0.05 if not specified. • Give p-value 4 decimal placesunless otherwise specified. • These practice problems have some output from SPSS – old problems from other courses. Added to help • On final no output in SPSS but you should know how to calculate p-value. • http://www.learnviaweb.com/course-material/statistics-practice-problems/ • Has PDF file javascript embedded with some stuff that may help.
What to do when – Select the most appropriate test. • One sample t-test • Paired t-test • Two-sample t-test (independent samples) • Binomial test of one proportion (z-approximation) • Test of two proportions • Chi-square test • ANOVA • GLM and correlation • Time Series • Hotelling T-Test • MANOVA • Logistic Regression • Discriminant Analysis • Principal Component Analysis or Factor Analysis • Cluster Analysis
Which Test Is Best? Are managers on average taller than 180cm? You randomly sample 100 managers Are less than 50% of the managers women? You sample 100 managers. Is there a relationship between gender and level in the company (staff, manager, sales)? Do male and female managers have the same height on average?
Which Test Is Best? Are managers on average taller than 180cm? You randomly sample 100 managers. (A) –one sample t-test. Are less than 50% of the managers women? You sample 100 managers. (D) binomial test of one proportion. Is there a relationship between gender and level in the company (staff, manager, sales)? (F) chi-square test. Do male and female managers have the same height on average? (C) two-sample t-test.
Which Test Is Best? Predict next years sales using the previous 5 years sales data. You know minutes used and you want create an equation to predict minutes used using, gender income and location. Is there a difference in average height for different levels in the company (staff, manager, sales)? Are there more women than men in Bangkok – you take a random sample of 500 people in Bangkok. Are husbands on average older than their wives? You sample 100 married people.
Which Test Is Best? Predict next years sales using the previous 5 years sales data. (I) Times Series You know minutes used and you want create an equation to predict minutes used using, gender income and location. (H) GLM Is there a difference in average height for different levels in the company (staff, manager, sales)? (G)- ANOVA Are there more women than men in Bangkok – you take a random sample of 500 people in Bangkok. (D) Binomial test Are husbands on average older than their wives? You sample 100 married people. (B) paired t-test
Which Test Is Best? Is the percent of women working higher than the percent of men working? I want to create a function relating cholesterol to gender, height, and weight. Do older brothers have higher grades than younger brothers on average? You sample 100 families with 2 boys (no twins).
Which Test Is Best? Is the percent of women working higher than the percent of men working? (E) test of two proportions. I want to create a function relating cholesterol to gender, height, and weight. (H) GLM Do older brothers have higher grades than younger brothers on average? You sample 100 families with 2 boys (no twins). (B) paired t-test
Select Best Test • There is multicolinearity in the independent variables and you wish to eliminated multicolinearity but keep all the information. You don’t care about the meaning of the independent variables. • Assume you have measured 5 different conflict management styles using many questions and a likert scale. You take the average of the questions to get 5 different continuous measures of the conflict management styles. You wish to know if there is a difference in styles used when considering gender and nationality. • You are a phone company with 5 phone plan types. You wish to predict phone plan type chosen using age, gender, and income. • Do men living in BKK have an average height equal to 175 CM and average weight equal 65KG?
Select Best Test • There is multicolinearity in the independent variables and you wish to eliminated multicolinearity but keep all the information. You don’t care about the meaning of the independent variables. Answer: PCA • Assume you have measured 5 different conflict management styles using many questions and a likert scale. You take the average of the questions to get 5 different continuous measures of the conflict management styles. You wish to know if there is a difference in styles used when considering gender and nationality. Answer: MANOVA. • You are a phone company with 5 phone plan types. You wish to predict phone plan type chosen using age, gender, and income. Answer: Discriminant Analysis • Do men living in BKK have an average height equal to 175 CM and average weight equal 65KG? Answer: Hotelling T-test
Select Best Test • I wish to predict if a customer applying for a credit card is committing fraud by pretending he/she is someone else, application fraud. I have data of past application fraud and various other information such as zip code match/mismatch, birthdate match/mismatch etc. • Do women spend more than men on average in Bangkok when they go shopping? • There are many variables for understanding corporate culture. Is there are way to summarize these variables into a fewer set of variables? • How to group the various bicycle types that exist using many different attributes of bicycles – size weight material etc.
Select Best Test • I wish to predict if a customer applying for a credit card is committing fraud by pretending he/she is someone else, application fraud. I have data of past application fraud and various other information such as zip code match/mismatch, birthdate match/mismatch etc. Answer - logistic • Do women spend more than men on average in Bangkok when they go shopping? Answer – two-sample t-test • There are many variables for understanding corporate culture. Is there are way to summarize these variables into a fewer set of variables? Answer - Factor analysis • How to group the various bicycle types that exist using many different attributes of bicycles – size weight material etc. Answer –cluster analysis
Theory population mean x is less than y? Would you reject or fail to reject the null hypothesis? Give P-value.
Theory population mean x is less than y? Would you reject or fail to reject the null hypothesis? Give P-value. Reject and p-value=0.000/2=0.000
Theory population mean x is greater than y? Would you reject or fail to reject the null hypothesis? Give P-value.
Theory population mean x is greater than y? Would you reject or fail to reject the null hypothesis? Give P-value. Fail to reject. P-value = 1-.1245/2=.93775
Theory population mean x is less than 6? Would you reject or fail to reject the null hypothesis? Give P-value.
Theory population mean x is less than 6? Would you reject or fail to reject the null hypothesis? Give P-value. Fail to reject. P-value=0.307
What percent of variation is accounted for in Comp. 2? What percent of variation is captured using the 1st 3 components?
What percent of variation is accounted for in Comp. 2? 5.3% What percent of variation is captured using the 1st 3 components? 99.5%
What variables should u keep in the model, alpha=0.05? What type of regression was performed on the data? Logistic – regression.
Give R-command • What is the command to do logistic regression in R? • glm(y~x1+x2 …,family=binomial(logit)) • Give command for two-sided two sample t-test in R • Give for paired t-test … • t.test(a,b, paired=TRUE) • Code to make alternative a two-sided test for the t-test. alternative = c("two.sided") • Etc ….
You have been asked to investigate the average height of female managers.Assume that female's height has a normal distribution. It is believed that the female's height has a mean greater than 157.79 cm. Give me the p-value and decide reject or fail to reject the null hypothesis. .281, fail to reject.
Assume that widgets are produced with a normal distribution. You have two machines that produce widgets for your company. The machines that produce widgets assume they different standard deviation.It is believed that widgets from machine 1 have a mean less than that of widgets from machine 2 Don't assume the variances are equal. Assume they are unequal. • Give me the p-value and decide reject or fail to reject the null hypothesis. • P-value=.143 fail to reject.
Employees at your firm are randomly selected to take a training course. The course is on risk management. To determine the effectiveness of this course the employees attending the course were given an exam before and after on risk management. It is believed that the before training exam will be greater than after training exam. • Give me the p-value and decide reject or fail to reject the null hypothesis. P-value=.304, fail to reject
What is correlation, p-value and reject or fail to reject? Correlation = .016, p-value .965 and fail to reject.
You have been told there exists a linear relationship between two variables. Test if the slope is not zero. P-value, rejector fail reject. .003, reject.
Reading Computer Output • Estimate sale price landval=1000, improval=500, neighborhood=F
Reading Computer Output • Which variables are significant? List them: landval, improval, nbrhood – all.