Download
1 / 34
340 likes | 515 Views
The role of ecosystem ecology in estuarine ecosystem managment. Mike Piehler UNC-CH Institute of Marine Sciences UNC Coastal Studies Institute. “We can't solve problems by using the same kind of thinking we used when we created them.” Albert Einstein. Watershed Approach.

E N D
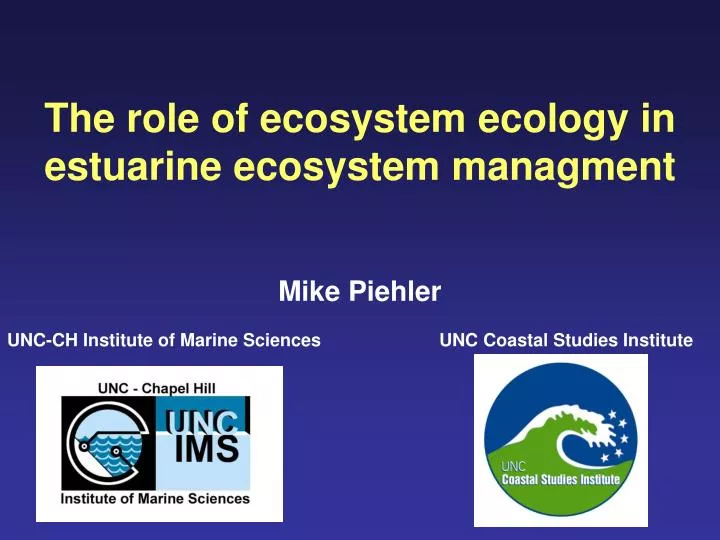
The role of ecosystem ecology in estuarine ecosystem managment Mike Piehler UNC-CH Institute of Marine Sciences UNC Coastal Studies Institute
“We can't solve problems by using the same kind of thinking we used when we created them.” Albert Einstein
Watershed Approach • Partnerships -- Those people most affected by management decisions are involved throughout and shape key decisions. • Geographic Focus -- Activities are directed within specific geographic areas, typically the areas that drain to surface water bodies or that recharge or overlay ground waters or a combination of both. • Sound Management Techniques based on Strong Science and Data • assessment and characterization of the natural resources and the communities that depend upon them; • goal setting and identification of environmental objectives based on the condition or vulnerability of resources and the needs of the aquatic ecosystem and the people within the community; • identification of priority problems; • development of specific management options and action plans; • implementation; and • evaluation of effectiveness and revision of plans, as needed.
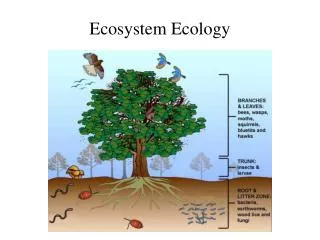
Watershed conservation, restoration and rehabilitation • Terrestrial • Land-water margin • Aquatic • Atmospheric
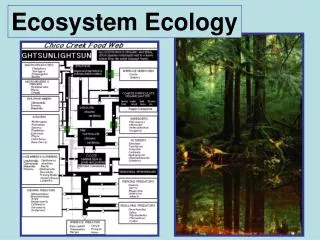
Sources Transport Transformation
Water management • Minimize consumptive uses • Remove obstructions • Maintain natural connectivity between aquatic and terrestrial systems • Consider flow management where tenable
Nutrient management • Identify limiting nutrients • Identify sources of the limiting nutrients in the watershed • Identify a tenable and effective reduction target • Manage point sources where possible • Manage non-point sources as appropriate
Application of ecosystem ecology • Are BMPs really the best? • Can estuarine nutrient management exacerbate eutrophication? • Is the application of ecological threshold theory of value to estuarine nutrient management?
Neuse River Estuary A cap on nitrogen load and a 30% loading reduction have been mandated for the Neuse River Estuary (NRE) watershed
“The Neuse Rules” • Includes rules for wastewater, urban stormwater, agriculture and general nutrient management • Utilization of agricultural Best Management Practices (BMPs) is among the alternatives for agricultural operations in the NRE to become compliant under the Neuse Rules • Understanding the effectiveness of BMPs such as constructed wetlands is critical to guiding the process and eventually assessing the success of the nutrient reduction efforts
Open Grounds Farm • ~45,000 acre row crop farm • Crops include corn, soybeans, wheat and cotton • Constructed wetland built in 1999 on 20 acre site • Significant proportions of the runoff from OGF enters the South River and then the NRE
The bottom line… 46% 34% 32%
Open Grounds Farm – 2001 • Dry much of the year • Watershed of the wetland was planted in corn • Fertilizer spill 4-4-01 • ~200-300 gallons • 50% UAN • 50% 11-37-0 (N-P-K)
Neuse River Estuary nitrate ug l-1 ammonium phosphate
Why worry about stimulating estuarine microbial N2 fixation? 10 m a. e. b. d. c. f. • Many N2 fixing species are nuisance organisms, and their proliferation may decrease water quality • Biological fixation of N2 may circumvent engineered N loading reductions • Selection for N2 fixing organisms may cause trophic disruption by increasing abundances of less palatable or less nutritious phytoplankton Anabaena aphanizomenoides (a) Anabaenopsis sp. (b) Cylindrospermopsis raciborskii (c, d) Anabaena compacta (e, f)
7L Neuse River Water 3L Major Ion Solution 10L Neuse River water +P 30% Dilution 30% Dilution Marker 15 Control Dilution Bioassay Setup N & P reduced N reduced N:P reduced
July 1997 Acetylene Reduction / chlorophyll a (nmol C2H4 l-1mg Chl a-1 h-1) Assimilation Number (mg C mg Chl a-1 h-1) Assimilation Number Acetylene Reduction
Acetylene Reduction / chlorophyll a (nmol C2H4 l-1mg Chl a-1 h-1) Assimilation Number (mg C mg Chl a-1 h-1) Assimilation Number Acetylene Reduction July 1998
Acetylene Reduction / chlorophyll a (nmol C2H4 l-1mg Chl a-1 h-1) Assimilation Number (mg C mg Chl a-1 h-1) Assimilation Number Acetylene Reduction August 1998
What is the potential importance of N2 fixation to the NRE N budget? 7x10⁷ m2 1.25 x 10⁻⁵ mol N m-3 y-1 120 d y-1 12 h d-1 2 m deep 3.5X10⁴ kg N as much as 3% of riverine DIN load to NRE
Evolving scientific basis for management • Ecological thresholds • Ecosystem responses to forcing are often discontinuous and non-linear • Threshold - A critical value of a pressure beyond which a state indicator shifts to a different regime
Status Indicator Proximal Driver Ultimate Driver = f e.g. nutrient concentrations and/or flow regime e.g. land use Ecological goods and services
12 TP TP 10 8 TP (µM) 6 4 2 0 1986 1988 1990 1992 1994 1996 1998 2000 2002 1982 1984 1978 1980 1970 1972 1974 1976 Year 60 Chl a 50 ) -1 (µg L 40 a 30 Chlorophyll 20 10 0 1986 1988 1990 1994 1996 2004 1982 1984 1992 1998 2002 2000 1980 1970 1972 1976 1978 1974 Year
TMDL for nitrogen in the Neuse River Estuary nitrogen load D D phytoplankton estuarine ecosystem services D