1 / 0

Wars in History

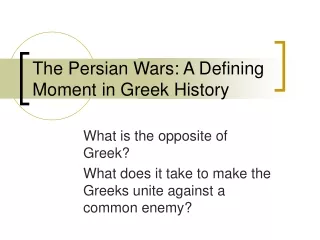
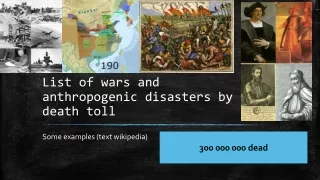
Wars in History. A look at the politics behind the Wars of the past By Michael Cannito Ronen Peled Christina Sylvester. Introduction. All the data obtained in this report is from three years prior to a given war, the war itself, and three years after the war.

zarek
Download Presentation

Wars in History

An Image/Link below is provided (as is) to download presentation Download Policy: Content on the Website is provided to you AS IS for your information and personal use and may not be sold / licensed / shared on other websites without getting consent from its author. Content is provided to you AS IS for your information and personal use only. Download presentation by click this link. While downloading, if for some reason you are not able to download a presentation, the publisher may have deleted the file from their server. During download, if you can't get a presentation, the file might be deleted by the publisher.

E N D

Presentation Transcript


  1. Wars in History

    A look at the politics behind the Wars of the past By Michael Cannito Ronen Peled Christina Sylvester
  2. Introduction All the data obtained in this report is from three years prior to a given war, the war itself, and three years after the war. The four wars included in our analysis are World War II (1941-1945), The Korean War (1950-1953), The Vietnam War (1964-1973), and The Gulf War (1990-1991).
  3. Questions to be Answered Does War effect per capita income obtained through the GNP? Does War effect poverty taking the Racial aspect into account? Did the wars bring us out of deficit, give us a surplus, or plunge us into a bigger one than we already had? Did War make us go into recession or pull us out of recession? Is war profitable and beneficial to the American Economy through analyzing the GDP?
  4. What we want to Conclude Our main point is to deduce whether or not war is profitable through GDP to the American Economy using the answers obtained from the first few questions. Our null hypothesis is that war does not affect the GDP and thus does not affect the economy Our alternative hypothesis is that war does have an effect on GDP and thus does affect the economy through the questions that will be answered.
  5. GDP One of the national data points we will use to determine if war benefits the American economy is the Gross Domestic Product, or GDP GDP measures the value of the goods and services produced by the U.S. economy in a given time period. GDP is composed of goods and services that are produced for sale in the “market”– the generic term referring to the forum for economic transactions – and of nonmarket goods and services – those that are not sold in the market.
  6. GDP Uses Used by the White House and Congress to prepare the Federal Budget The Federal Reserve uses it to formulate monetary policy Wall Street uses it as an indicator of economic activity Business communities use it to prepare forecasts of economic performance that provide the basis for production, investment, and employment planning
  7. GDP Graphs and Analysis This shows that US GDP has been almost always increasing from the year prior.
  8. Graphs and Analysis II This shows the % change in US GDP by year. Wars do impact the GDP as you can see by the spikes in the graph
  9. GNP The Gross National Product or GNP is the total dollar value of all final goods and services produced for consumption in society during a particular time period. Its rise or fall measures economic activity based on the labor and production output within a country. The tangible factors used to calculate this include, but are not limited to cars, furniture, bread, education, healthcare, and auto repair.
  10. Gross National Product Graphical summaries are presented below.
  11. Gross National Product II A continuation from the previous slide
  12. GDP vs. GNP A country's Gross Domestic Product, or GDP, is the amount of goods and services, measured at market prices, produced within the country during a particular time period (usually a year). Gross National Product, or GNP, is the amount of goods and services produced by residents of a country, regardless of where that production takes place.
  13. Per Capita Income Per capita income is the mean income computed for every man, woman, and child in a particular group. It is derived by dividing the total income of a particular group by the total population. It reflects GNP. The factors that appear in per capita income include but are not limited to wealth as in the Euro or the U.S dollar, national income levels, and personal income for each individual person or home. In all of these wars, you will see that Per Capita Income rises after during the war and peaks after the war.
  14. World War II Simple linear regression to show increasing income
  15. Vietnam War Simple linear regression to show increasing income
  16. Korean War Simple linear regression to show increasing income
  17. Gulf War Simple linear regression to show increasing income
  18. World War II Multiple Linear Regression with Per Capita income as the response variable and all the others as explanatory variables As you can see it is positively increasing linearly This data is very good with the R value being 0.9882 and the p-value at 1.217*10^-5 which is significant.
  19. Vietnam War Multiple Linear Regression with Per Capita income as the response variable and all the others as explanatory variables Again, it is very linear with positive increases all around We see that Surplus/Def does not go with the graph, but the surplus/deficit is very important for our study later on. The R^2 value is 0.9807 with a p-value of 4.387*10^-10 which again shows very important significance.
  20. Korean War Multiple Linear Regression with Per Capita income as the response variable and all the others as explanatory variables It is the same explanation as above showing how per capita income increases as war goes on and eventually caps at a new high after the war is over The R^2 value is 0.988 and the p-value is 1.262*10^-5 which is significant
  21. Gulf War Multiple Linear Regression with Per Capita income as the response variable and all the others as explanatory variables The same applies to the Gulf War also, Per Capita income increases as the war goes on to a new cap The R^2 value is 0.9989 and the p-value is 2.469*10^-5 which is significant.
  22. Conclusion Per Capita Income As you can see from all of these slides using single regression and multiple regression that Per Capita Income increases with war and by the end a new cap is reached further bettering our society. Even though as you will see later that Poverty and Deficit occur in times of war, it is also very profitable.
  23. Poverty Does America deal with greater Poverty in War? The data for Poverty was only recorded on the federal level from the years 1959 and on. What could be some of the reasons for this? Did they realize that poverty is a contributing factor in war? In proving our alternative hypothesis below that war is profitable, does poverty factor into that profitability or are we taking money away from the people who need it?
  24. Poverty Overall in the Vietnam The races in comparison in this war are African Americans vs. Caucasians vs. All Races
  25. Vietnam War II Racial Comparison in graph form
  26. Racial Comparison in Vietnam War This is a comparison to the national average African Americans have greater poverty levels than whites throughout wars The poverty level of African Americans compared to all races decrease while poverty level of whites increase compared to all races The civil rights movement affects the race relations.
  27. Poverty Overall in the Gulf War Poverty exponentially growing for the Gulf War years
  28. Racial Comparisons in Gulf War This is the Poverty for a specific race and the conclusion made about them African Americans increased throughout the war Caucasian Americans increase d throughout the war Hispanic Americans increases throughout the war Asian Americans were scattered but overall decreased in the war African Americans and Hispanic Americans are overall underprivileged minorities and have a deeper poverty level
  29. Gulf War II Racial Comparisons in graph form
  30. Gulf War III Racial Comparisons II
  31. Conclusion of Racial Comparisons This is a comparison to the national averages The African American poverty level decreases dramatically but still sits high in absolute terms, by more than double The Caucasian poverty level increases but throughout the war is less than national average The Hispanic poverty level decreases throughout the war but is more than double the national level The Asian poverty level decreases and is about the same as the national level
  32. Poverty Conclusion Race is an influencing factor in determining poverty of a certain group. Poverty is reflected by income, so if data were present on income by race, we could show a similar trend in income status by racial group for the gulf war and any other war presented with the right data.
  33. Deficit Deficit is when an entity (often the government) spends more money than it takes in. Surplus is when an entity (often the government) spends less money than it takes in. There are a few types of deficit that will be discussed and mentioned below Trade Deficit Deficit/Surplus
  34. Trade Deficit Trade deficit is the difference between exports and imports. If trade deficit is <0, then we owe money and is very bad for the American economy. For the first three wars, trade deficit grows during the wars and then recovers afterwards For the Gulf War, trade deficit contracts. What factors could do this and shift the pattern?
  35. Trade Deficit Graphs The graphs that support the analysis above
  36. Trade Deficit Graphs II Graph’s Cont’d
  37. Surplus/Deficit Surplus becomes a deficit or a current deficit becomes worse in war By analysis, Vietnam follows similar behavior if you cut the war period of time in half. The graphs are to follow. Through the analysis below, we are plunged into deficit with war, but the war increases profitability including individual incomes which provides more for the populous. The national economy as a whole is also increasing through GDP, GNP, Per Capita Income, and eventually we come out of this deficit when the war is over.
  38. Graphs of Surplus/Deficit The graphs are below
  39. Graphs of Surplus/Deficit II Graphs Cont’d
  40. Recession A recession is a decline in an country’s (GDP), or negative real economic growth, for two or more successive quarters of a year. It is important to show at what times the US has entered recessions. If they seem to be common before, during, or after there may be a direct link between the two. This will ultimately help with the final conclusion which is to fully support or not, the wars economically benefiting the economy.
  41. A list of all the Recessions 1947q2 -0.5 1974q3 -3.8 1947q3 -0.2 1974q4 -1.6 1949q1 -5.8 1975q1 -4.7 1949q2 -1.2 1980q2 -7.8 1953q3 -2.4 1980q3 -0. 7 1953q4 -6.2 1981q2 -3.1 1954q1 -2.0 1981q3 -4.9 1957q4 -4.2 1981q4 -4.9 1958q1 -10.4 1982q1 -6.4 1969q4 -1.9 1990q4 -3.0 1970q1 -0.7 1991q1 -2.0
  42. Analysis of Recession 22 quarters of the 304 quarters of the data is available Only about 7.24% of the quarters the US was in a recession Korean War brought us out of recession (1949); But put us back into one when it ended (1953-54) Recession occurred for three quarters after the Vietnam War (1974q3-1975q1) Recession also occurred during the most part of the Gulf War (1990-1991)
  43. Analysis II Eight quarters of the 22 are related to American Wars; Not including the recessions of the Korean War that may or may not have helped America exit out of. 36.36% of the American recessions are related to American Wars. The many recessions in the 1980’s were caused by the tight monetary policy in the U.S. to control inflation and sharp correction to overproduction of the previous decade which had been masked by inflation.
  44. Conclusion about Recession We can theorize that war can bring a country out of a recession as seen through the data It also causes it to fall into economic recession once it has ended, again, as seen through the data. Do you think that war is worth the recession it brings us out of or plunges us into?
  45. Is War Profitable? We will try to analyze if war does affect the GDP and thus the overall economic situation of the U.S. It will show if the effect is positive or negative (GDP growth or decline).
  46. World War II Graphically and Mathematically are shown below.
  47. World War II, II Linearly Graphed with and without World War II
  48. World War II, III Through the graphs we see that for the actual GDP the data point is above the regression line and because of the R^2 value of 0.956 we have almost perfect correlation between data points. Removing the WWII GDP data points from the set we see that the R^2 value increases which proves our alternative hypothesis and war does significantly impact the US GDP.
  49. Korean War Graphically and Mathematically are shown below.
  50. Korean War II Linearly graphed with and without the Korean War
  51. Korean War III The R^2 value with the R value is 0.976 and shows a positive influence on the GDP as shown in World War II Calculating the GDP without the war increases the R^2 value and concludes that war did have a positive effect on the US GDP.
  52. Vietnam War Mathematically and Graphically are below.
  53. Vietnam War II Linearly graphed with and without the Vietnam War
  54. Vietnam War III This is the first war that the U.S. had actually lost so the graphs are very fluctuant because of this fact. The GDP actually falls below the regression line with the Vietnam War, but nonetheless has a R^2 value of 0.950 Without the war the R^2 value has increased thus confirming our alternative hypothesis. Even though GDP fell below the regression line we conclude that the economy still benefited from this war.
  55. Gulf War Mathematically and Graphically are shown below.
  56. Gulf War II Linearly Graphed with and without the Gulf War
  57. Gulf War III This was one of the shortest wars in history which means it had a much smaller impact on the GDP and the U.S. Economy. With the war the R^2 value is 0.995 and without it, it jumped to 0.997 thus confirming our alternative hypothesis that the war does affect GDP even if it only be a small amount.
  58. Conclusion about Profitability This data suggests that the American wars do contribute to the U.S. economy via the GDP in this case. This is always a positive manner but sometimes does not seem to outpace what the economy could have produced without the war. War is profitable based on GDP and just think where we would be without it.
  59. Conclusion After answering all the questions we realize that war is profitable through a positive correlation and yet puts us into a deficit, but we eventually get out of it. We reject our null hypothesis and keep our alternative hypothesis, thus confirming what we believed the whole time. Any Questions…
More Related