Download
1 / 48
480 likes | 644 Views
Modeling West Nile virus Distribution from Surveillance Data. Josh Bader 16 February 2009 University of California-Santa Barbara Department of Geography. Outline. Biogeography Background WNV Background My Research Conceptual model Predicting WNV distribution

E N D
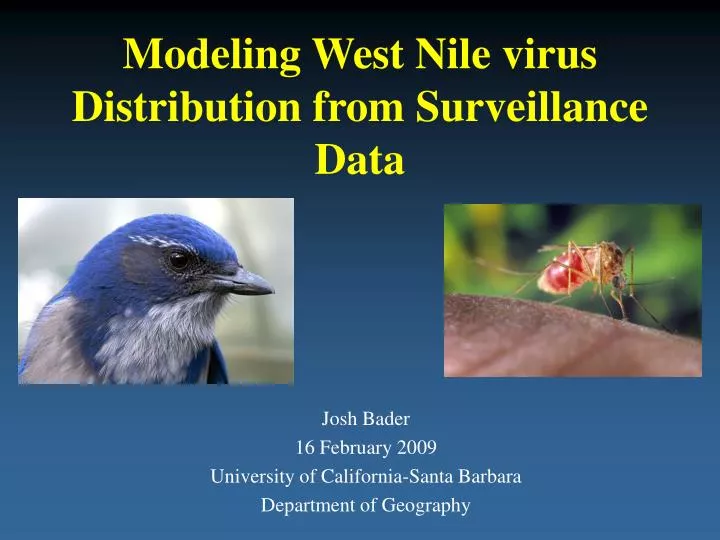
Modeling West Nile virus Distribution from Surveillance Data Josh Bader 16 February 2009 University of California-Santa Barbara Department of Geography
Outline • Biogeography Background • WNV Background • My Research • Conceptual model • Predicting WNV distribution • Identify optimal surveillance location
Biogeography • Intersection of life sciences and geography • Also ecology, geology, molecular biology • Two divisions • Historical • Evolutionary perspective • Pleistocene Ice Age • Ecological • Modern persective • Why are species where they are (were)?
Biology • Process behind spatial distributions • Without tolerance limits, a species will occupy all available areas--maximum dispersion • Limits determined by: • Biotic factors • Abiotic factors • Genetics • Population dynamics • Intraspecies and interspecies • Often related to fundamental niche of species
Potential range map Deductive Approach Biological Information Geographic Information • Habitat Req. • Tolerance limits • Presence/Absence • Land cover, etc. Inductive Approach
Biogeography Links • California Wildlife Habitat Relationships • http://www.dfg.ca.gov/bdb/html/cwhr.html • GAP Analysis • California: http://www.biogeog.ucsb.edu/projects/gap/gap_proj.html • National: http://gapanalysis.nbii.gov/
Outline • Biogeography Background • WNV Background • My Research • Conceptual model • Predicting WNV distribution • Identify optimal surveillance location
West Nile virus • First isolated in Uganda—1937 • First detected in US—1999 • Since spread to entire contiguous 48 states • Infection can cause range of symptoms • Mild: West Nile fever • Severe: Encephalitis and Meningitis • 2003: 9862 cases & 264 deaths • 2004: 2539 cases & 100 deaths • 2005: 3000 cases & 119 deaths • 2006: 4219 cases & 161 deaths • 2007: 906 cases & 26 deaths • 2008: 1370 cases & 37 deaths http://www.cdc.gov/ncidod/dvbid/westnile/index.htm
Source: http://www.cdc.gov/ncidod/dvbid/westnile/Mapsactivity/surv&control06Maps.htm
http://www.cdc.gov/ncidod/dvbid/westnile/Mapsactivity/surv&control07Maps.htmhttp://www.cdc.gov/ncidod/dvbid/westnile/Mapsactivity/surv&control07Maps.htm
http://www.cdc.gov/ncidod/dvbid/westnile/Mapsactivity/surv&control08Maps.htmhttp://www.cdc.gov/ncidod/dvbid/westnile/Mapsactivity/surv&control08Maps.htm
Surveillance • Human • Mandatory reporting to CDC • Blood donations • Point of infection difficult to ascertain • Mosquito • Set trap locations • Trap placement important
Surveillance • Sentinel chickens • Similar to mosquito • Show seroconversion • Effort > warning • Veterinary • Similar to human surveillance • Mainly equines • Vaccine available http://www.hhs.state.ne.us/wnv/
Surveillance • Dead bird • Good early indicators • Rely on public participation • Find a dead birdCall hotline • 1-877-WNV-BIRD • Species and condition important • Volunteered geographic information
Know Your WNV Hosts A. B. C. F. D. E.
Surveillance Links • California • http://westnile.ca.gov/latest_activity.php • National (CDC) • http://www.cdc.gov/ncidod/dvbid/westnile/index.htm • National (USGS) • http://diseasemaps.usgs.gov/
Why map WNV? • Ultimate goal: limit human infection • Map migration across the country • Identify areas of high risk for mosquito control and health alerts • Determine outbreak patterns • Perennial: Japanese encephalitis • Sporadic: St. Louis encephalitis http://www.cdc.gov/ncidod/dvbid/westnile/index.htm
Previous Work • Disease Mapping • Largely descriptive • Little predictive value • No process behind pattern • Geographic Correlation • Sin Nombre—mice • Lyme—ticks • DYCAST • Predict hotspots from dead bird reports • Urban areas http://westnile.ca.gov/2005_maps.htm
Outline • Biogeography Background • WNV Background • My Research • Conceptual model • Predicting WNV distribution • Identify optimal surveillance location
Research Objectives • Define a conceptual model for WNV distribution • Predict WNV distribution from surveillance data and ancillary environmental variables • Identify optimal areas for additional surveillance sampling
I. Conceptual Model • Ecological/biogeographical approach • Mapping WNV as function of pertinent life cycle components • Virus propagation areas • Amplification and transmission • “Reproductive range” • WNV only needs reservoir host (birds) and vector (mosquito) • Human, sentinel, and veterinary instances can be considered sterile
I. Habitat suitability models • Based on Hutchinson’s (1957) concept of niche • Hypervolume where species is found within suitable ranges for all variables • Biology reflected in habitat selection • Fundamental niche • Realized niche does not often match fundamental niche • Includes biotic interactions and competitive exclusion • Species is not at equilibrium • Number of multivariate techniques • Probabilistic techniques are similar • High suitability implies high presence probability
I. Hosts + Vectors • Suitability/probabilistic techniques classify area for one species • Multiple reservoir and vector species • Need at least one host and one vector • P(H) = P(H1U H2) = P(H1) + P(H2) – P(H1∩H2) • P(V) = P(V1U V2) = P(V1) + P(V2) – P(V1∩V2) • P(WNV) = P(H ∩V)
Study Area • W Kern County • W of Sierra Nevada mountains • 10,000 sq. km • Kern Co. MVCD • Jepson’s ecoregions • Rural & urban • 20+ data points for for 2 intermediate hosts and 2 vectors • 2004 season
Intermediate Hosts • Corvids most important • Susceptible, conspicuous, recognizable • 8 species within study area • American Crow • Corvus brachyrhynchus • cosmopolitan • Woodlands, grasslands, croplands, and urban areas • Western Scrub-jay • Aphelocoma californicus • More selective • Woodlands & shrublands—Oak • Residential urban areas
Vectors • Genus Culex • Permanent water breeders • Bloodfeeding usually close to breeding sites • Culex tarsalis • Western encephalitis mosquito • Irrigation ditches, riparian • Culex pipiens quinquefasciatus • Southern House mosquito • Urban environments (e.g. sewer catch basins) http://www.usask.ca http://www.fehd.gov.hk
Variable Selection • 7-10 Eco-geographic variables (EGV) per species • 1 km --- 10,000 pixels • General EGVs • Elevation, Percent Urban, Distance to water • Species Specific • Mosquitoes—hydrographic; Birds—land cover • Neighborhood layers will account for species range size • Mosquitoes—0.03-0.04 sq. km • Jays--0.03 sq km; Crow--0.1-0.5 sq km
II. Presence/absence Methods • Presence/absence • Ex. regression • Potentially more predictive power • Reliable absences difficult to obtain for animals • Species is present, but not detected • Imperfect detectability of target species • Species is absent, even though habitat is suitable • Presence-only • Ex. ENFA • Trade off: predictive power vs. unreliable absences
II. Bayesian Model • Conditional probabilities of Bayes Theorem • Probability of WNV positive given a series of EGV values • Advantages • Presence-only when EGVs known everywhere • Easy to integrate new presences • Presence and EGV data—rasters • Matlab • For each species, two sets of histograms • Global—EGV values over entire study area • Presence subset—EGV values at presence locations • Multivariate probability density functions
II. Bayes Theorem P(H1|EGV) = P(H1) * P(EGV| H1) _______________________________________ P(H1)*P(EGV| H1) + P(absence)*P(EGV|absence) P(H1) = probability of WNV positive intermediate host of species 1 over the entire study area P(EGV| H1) = probability of EGV value within WNV positive H1 subset Denominator = probability of EGV value within global set P(EGV)
II. Simulation • Problem: presence subset not exhaustive • P(H1) not known • P(EGV| H1) not fully characterized • Needs to be augmented • Total presence probability P(H1) estimated from focal species range within study area • Maximum WNV dispersal • Additional presences simulated until threshold met • Areas near presences are preferentially weighted • P(EGV| H1) updated • Presence probability map for simulated P(EGV| H1) • Many simulations (n=1000) • Distribution of presence probabilities for each pixel
Prob. Crow (H1) Prob. Host Prob. Jay (H2) Prob. WNV Prob. Tars. (V1) Prob. Vector Prob. Quin. (V2) II. Flowchart • Composite probability map for each species • Combined using definition of P(WNV)
II. Presence/Absence Maps • Convert WNV probability to binary presence/absence • Receiver Operating Characteristic plots • Determines threshold that most accurately separates 2 classes • Requires validation dataset • Sentinel data • For each threshold, sensitivity-specificity pair is calculated • Sensitivity: true positive fraction • a / (a + c) • 1 – Specificity: false positive fraction • d / (b + d)
ROC plots • Tangent line defines optimal sensitivity-specificity pair • Corresponding threshold considered best separation value • Slope can be function of false positive and false negative costs • AUC can be used as index of overall modelaccuracy • Use threshold to change probability to binary map Fielding and Bell 1997
III. Optimizing Surveillance • Surveillance is expensive • Improve efficiency • Identify areas for additional sampling that provide the most information on virus activity • Improve separation between presence/absence classes • Optimal site • Ambiguous P(WNV)—near threshold • Presence simulated and change quantified • Change in AUC of ROC plot
III. Optimizing Surveillance • Optimal sampling strategy • Number and locations of surveillance points • Loss function--monetary • Surveillance costs • Traps, testing, travel • Surveillance benefits • Improved efficiency of mosquito control • Less human cases • Suggestions to Kern Co. MVCD
Conclusion • WNV endemic to US • Public health significance • Spatial aspect of WNV is important • Direct surveillance • Direct mitigation • Research Objectives • Provide a model for mapping zoonotic disease • Method of relating presence-only data to EGV • Assessing the value of additional surveillance • Address academic and management issues • GIS works for both
Acknowledgements • Dr. Michael Goodchild • Dr. Phaedon Kyriakidis • Dr. Keith Clarke • Dr. Wayne Kramer Questions ??