Download
1 / 36
360 likes | 809 Views
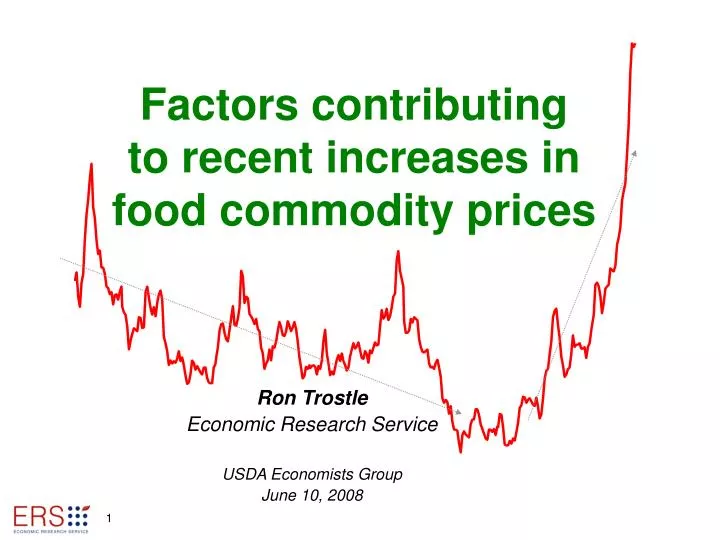
Factors contributing to recent increases in food commodity prices Ron Trostle Economic Research Service USDA Economists Group June 10, 2008 1 Food commodity prices: up 220 % since January 2002: 70 % since January 2006

E N D
Factors contributing to recent increases in food commodity prices Ron Trostle Economic Research Service USDA Economists Group June 10, 2008 1
Food commodity prices: up 220 % since January 2002: 70 % since January 2006 1/ Food Commodities include grains, vegetable oils, meats, sugar, and other basic food commodities. 2 Source: International Monetary Fund: International Financial Statistics
Food commodity prices: up 220 % since January 2002: 70 % since January 2006 Percent increase in prices since Jan 2002Jan 2006 Food Commodities 220 70 1/ Food Commodities include grains, vegetable oils, meats, sugar, and other basic food commodities. 3 Source: International Monetary Fund: International Financial Statistics
Prices of many commodities rose: Crude oil up 640 % since January 2002 Percent increase in prices since Jan 2002Jan 2006 Food Commodities 220 70 All commodities 405 80 Crude oil 640 97 1/ Food Commodities include grains, vegetable oils, meats, sugar, and other basic food commodities. 4 Source: International Monetary Fund: International Financial Statistics
Crop prices increase (wheat, soybeans, corn & rice) 5 Source: International Monetary Fund: International Financial Statistics
Real crop prices (wheat, soybeans, corn & rice) 6 Source: International Monetary Fund: International Financial Statistics
Crop price increases: real vs. nominal Average of 4 crops (wheat, soybeans, corn & rice) Real prices Nominal prices 7 Source: International Monetary Fund: International Financial Statistics
Factors contributing to higher food commodity prices Strong growth in demand, based on: Increasing population - Rapid economic growth - Rising per capita meat consumption 1996 1998 2000 2002 2004 2006 2007 2008 Slowing growth in ag production Declining stocks of food commodities Escalating crude oil price Rapid expansion biofuels production Dollar devaluation Large foreign exchange reserves Rising costs of ag production Adverse weather Demand factors in brown Aggressive purchases by importers Supply factors in green Exporter policies Importer policies 8
World grain & oilseeds Total production and use 9 Source: USDA PS&D Database
Total world grain & oilseeds Stocks and stocks-to-use ratio 10 Source: USDA PS&D Database
Long term trends contributing to higher food commodity prices • Demand-side trends • Supply-side trends 11
Population growth rates decline (Percent by period) Percent 12 Source: USDA Agricultural Baseline Projections to 2017.
Strong economic growth Average Real GDP growth rates Percent 13 Source: USDA Agricultural Baseline Projections to 2017.
Global meat1 Production and percapita consumption Index: 1971 = 100 Exponential trend growth rates: 1975-90 90-07 Production 3.1 2.5 Population 1.7 1.4 Per capita 1.4 1.1 consumption 1 Total meat = beef + pork + chickens & turkeys. 14 Source: USDA Agricultural Projections to 2017.
Global rice imports Million metric tons 1/ European Union, former Soviet Union, and other Europe. 2/ Includes Mexico. 15 Source: USDA Agricultural Baseline Projections to 2017.
Global soybean oil imports Million metric tons 1/ European Union, former Soviet Union, and other Europe. 2/ Asia excluding India and China. 3/ Includes Mexico. 16 Source: USDA Agricultural Baseline Projections to 2017.
Poultry imports 1/ Million metric tons 1/ Selected importers. 2/ EU-27 excludes intra-trade after 2002, EU-15 intra-trade before 2003, Slovenia before 1992. 17 Source: USDA Agricultural Baseline Projections to 2017.
Total world grain & oilseeds1 Production, yield, area harvested, population & percap production Index: 1970 = 100 Exponential trend growth rates: 1970-90 90-07 Production 2.2 1.3 Yields 2.0 1.1 Area 0.15 0.14 Population 1.7 1.4 Per capita use 0.56 0.11 1 Total oilseeds = soybeans + rapeseed + sunflowers 18 Source: USDA Agricultural Projections to 2017
Role of biofuels • Focus on feedstocks • Major producers • Impact on land use • Impact on price relationships 19
Biofuels production:Largest producers Million Gallons Ethanol Biodiesel 20 Source: USDA Agricultural Projections to 2017
U.S. corn use Billion bushels 1/ Food, seed, and industrial less ethanol. 21 Source: USDA Agricultural Baseline Projections to 2017.
Global wheat and coarse grains use, 2002/03 – 2007/08 MMT 100% Total Food and other non-feed (except US corn ethanol) 44% 27% Feed US corn ethanol 30% Crop year Note: Category’s share of the change in total use from 2002/03 to 2007/08. 22 Source: USDA’s PS&D Database and estimates from ERS
Other contributing factors • Higher energy prices • Weaker U.S. dollar • Increasing foreign exchange reserves held by importers • Adverse weather reduced crop production • Role of hedge funds, index funds, & sovereign wealth funds: • (affect demand and/or volatility?) 23
Value of U.S. dollar declines after 2002 1/ Index values, 2000=100 1/ Real U.S. agricultural trade-weighted dollar exchange rate, using U.S. agricultural export weights, based on 192 countries. 24 Source: USDA PS&D Database
Adverse weather reduced crop production in 2006 and 2007 • Ukraine & Russia: drought for 2 years • Australia: severe drought for 2 years • Europe: dry spring; harvest floods • SE Europe: drought • NW Africa: drought • USA: late spring freeze • Canada: hot and dry • Turkey: dry 26
Food Price Inflation:Policy responses by someexporters and importers • Export restrictions • Lower import tariffs • Consumer subsidies 27
Defensive measures to control inflation -- Exporters • Eliminated export subsidies: • China (grains & products) • Export taxes: • China (grains & products) • Argentina (wheat, corn, soybeans, soymeal, soyoil) • Russia (wheat) • Malaysia (palm oil) • Kazakhstan (wheat) • Export quantitative restrictions: • Argentina, Ukraine (wheat) • India & Vietnam (rice) • Export bans: • Ukraine, Serbia, India (wheat) • Egypt (rice) • Kazakhstan (oilseeds & veg oils) • Cambodia (rice to neighboring countries) • Indonesia (rice) 28
Defensive measures to control inflation -- Importers • Reduce Import tariffs: • India (wheat flour) • Indonesia (soybeans, wheat; will “green line” wheat flour) • Serbia (wheat) • Thailand (pork) • EU (grains) • Korea & Mongolia • Subsidized distribution of imported staples • Morocco (import wheat; subsidize bread sales) • Promoting a/o subsidizing production: • Indonesia (soybeans) • Other: • Iran imported corn from the USA 29
Other developments • Domestic price controls: • China (cooking oils, grain, meat, milk & eggs) • Thailand (food) • Protests • Malaysia (millers & bakers) • Indonesia (soybean prices; meat prices) • Pakistan (wheat) • USA (wheat) • Food riots: Guinea Mauritania Morocco Senegal Cameroon Mexico Uzbekistan Yemen Niger Burkina Faso Egypt Haiti Ethiopia Philippines Thailand 30
Impact of high food commodity prices on consumers food budgets High-income Low-income countries food-deficit countries I. Base Scenario Income 40,000 800 Food expenditure 4,000 400 Food as % of income 10.0% 50% Disaggregate retail food spending (staples vs. non-staples) Staples as % of total food spending 20% 70% Expenditures on staples 800 280 Expenditures on non-staples 3,200 120 II. Scenario: 50% Price increase in staples Partial pass through on staples Assumed % pass through 60% 60% Increase in cost of staples 24084 New cost of staples 1040 364 New total food costs 4,240 484 Food as % of income10.6% 61% 31
U.S. Title II Food Aid Allocations $ Billion Million metric tons *2008 is an forecast 32
Food commodity price spikes since 1970 33 Source: International Monetary Fund: International Financial Statistics
Categories of factors contributing to higher food commodity prices Temporary factors: Structural changes: Questionable future impact: Continuation of long-term trends: • Rapid economic growth in many developing countries • Population growth in developing countries • Increasing per capita meat consumption • Adverse weather • Trade policies by exporters and importers • Aggressive buying by importers • Further dollar depreciation • Slower growth in ag productivity • Role of large foreign exchange reserves held by importers • High oil prices • Biofuels production • High ag production costs • Supply factors in green • Demand factors in brown 34
U.S. Commodity Prices: History & Projections Soybeans, Wheat, Corn, & Rice Projections from Nov 2007 USDA Baseline $ per bushel; ($ per cwt for rice) Rice Soybeans Wheat Corn Source: USDA Agricultural Baseline Projections to 2017, February 2008. 35
Global Agricultural Supply and Demand:Factors Contributing to the Recent Increase in Food Commodity Prices Report available at: http://www.ers.usda.gov/Publications/WRS0801/ Ronald Trostle Economic Research Service U.S. Department of Agriculture rtrostle@ers.usda.gov 202-694-5280 36