Download
1 / 57
580 likes | 916 Views
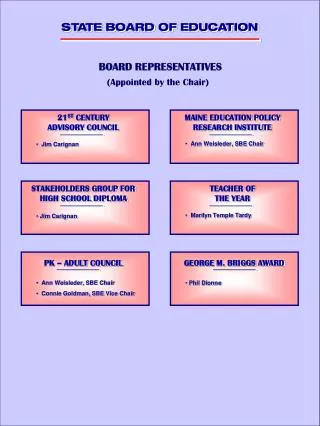
Florida State Board of Education 2010-11 Education Budget Request October 27, 2009. STATE BOARD OF EDUCATION. 2010-11 Education Budget Presentation October 27, 2009 Introduction Eric J. Smith PK-12 Education Frances Haithcock Workforce Education Loretta Costin

E N D
Florida State Board of Education2010-11 Education Budget RequestOctober 27, 2009
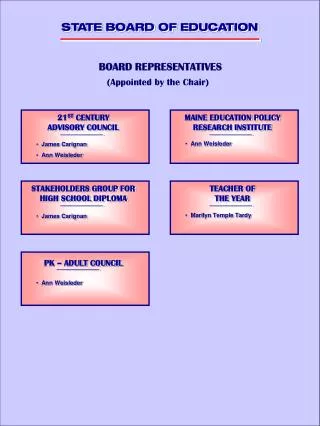
STATE BOARD OF EDUCATION 2010-11 Education Budget Presentation October 27, 2009 • Introduction Eric J. Smith • PK-12 Education Frances Haithcock • Workforce Education Loretta Costin • Florida Colleges Will Holcombe • Other Education Vocational Rehabilitation Linda Champion Blind Services Linda Champion Student Financial Assistance Linda Champion State Board of Education Linda Champion • Fixed Capital Outlay Linda Champion • State University System Kristie Harris
Introduction Dr. Eric J. Smith Commissioner of Education
National Assessment of Educational Progress (NAEP) Florida Mathematics Highlights 2009 • In 2009, the NAEP Grade 4 Mathematics scale score gap between Florida’s African-American and White students narrowed 3 points. The scale score gap decreased 6 points from 2003 to 2009. • From 2003 to 2009, the performance of Florida’s African-American students on NAEP Grade 8 Mathematics moved Florida’s status from ranking close to the bottom quarter of the 50 states, when comparing performance of this subgroup, to approximately the top third. • Since 2003, Florida’s African-American eighth-graders have narrowed the achievement gap with White students by 12 points in NAEP Grade 8 Mathematics, compared to the nation’s three point narrowing. • The percentage of Florida eighth-graders performing at or above Basic on NAEP Mathematics is equal to or greater than the national average for every student group tested in the state.
2009-10 Statewide All FundsOperations and Fixed Capital Outlay = $66.5 Billion
2009-10 Statewide General Revenue Appropriations (Operations and Fixed Capital Outlay) = $21.2 Billion
Department of Education Next Generation Strategic Initiatives
Voluntary Prekindergarten Program Dr. Frances Haithcock Chancellor, Public Schools
Voluntary Prekindergarten (VPK) 2008-09 VPK Data • 234,186 - Estimated Total Number of Four-Year-Olds • 147,706 - Total Number of Children Served (63% of all four-year-olds); 128,304 FTE Appropriated* 2009-10 VPK Data (as of July 30, 2009 VPK Estimating Conference) • 233,212 - Revised Estimated Total Number of Four-Year-Olds • 164,654 - Revised Total Number of Children Expected to be Served (66.70% of all four-year-olds) • 131,711 - Total Number of Children Enrolled (as of 10/23/09) (56% of all four-year-olds) • 136,957 FTE Appropriated* * Exceeded or Expected to Exceed Appropriation
2010-11 Voluntary Prekindergarten Program Funds 2010-11 Data • 233,442 - Estimated Total Number of 4 Year-Olds • 169,666 - Planning Estimate for VPK (68.80%) 2010-11 Legislative Budget Request • 145,397.05 Full-time Equivalent (FTE) • $2,575 Base Student Allocation (BSA) 2010-11 School Year • $2,190 Base Student Allocation (BSA) 2010-11 Summer • 4.85% Administrative Costs $389,202,790
2010-11 VPK Early Learning Standards and Accountability Provider Services • VPK Regional Facilitators • Printing and Distribution of Standards and Parent Guide • Professional Development for Teachers (in the area of mathematics – 2008 VPK Standards) • Statewide Implementation/Availability of VPK Reading and Mathematics Assessments (includes materials, training, and online reporting system) Accountability • VPK Provider Kindergarten Readiness Rate Web site and calculation of rate $950,000
K-12 Education Dr. Frances Haithcock Chancellor, Public Schools
2010-11 FEFP Strategic Investment 2,605,329 Students 2,678 Decrease in unweighted FTE $18,559,375,598 in State and Local Funds Provide $7,123.62 per student 3.59% increase of $246.63 per student
Workforce Education Loretta Costin Acting Chancellor, Workforce Education
Florida Workforce Education 2010-11Budget Request School District Workforce Education – Operating Funds 1. 2009-10 Appropriation for Workforce Education and Performance $ 382,589,931 2. Workload $ 25,766,749 Estimated increase in enrollment = 3,813 FTE Move select districts toward state funds per unweighted FTE of $3,958 Total Increase Requested $ 25,766,749 2010-11 Workforce Education and Performance $ 408,356,680 % Increase Over 2009-10 Appropriation 6.73% Workforce Education – Other Increase Adult Basic Education (Increase in Federal Budget Authority) $ 6,073,066 -Nonrecurring budget authority is requested for a one-time payment of federal funds for adult education and family literacy programs.
Workload Increase • Enrollment Growth $15,092,883 -estimated growth of $3,813 FTE • Compression/Equity $10,673,866 • Performance Increase N/A • Total Increase Appropriation $25,766,749
Ready to Work – Current Budget • Curriculum and Implementation Services $5,600,000 • Site Licenses 3,000,000 • Credentials 1,500,000 • Recruit Employers 450,000 • Contract Administration 650,000 • Assessments, Credentials, Employer Outreach $1,350,000 • Bank of Assessments 1,016,490 • Job Profiles 132,500 • Employ Florida 144,000 • Credential Printing 57,010 • Administrative Services $ 50,000 • Total Appropriation $7,000,000
Florida Colleges Dr. Will Holcombe Chancellor, Florida Colleges
An “open door” with a positive outcome! Comparison of FTE Enrollment to Total Degrees and Certificates Awarded Total Degrees and Certificates Awarded Public Two-Year Colleges (2006-2007) SREB States, 2007-2008 SREB - Southern Regional Education Board
Other Education- Division of Vocational Rehabilitation- Division of Blind Services- Student Financial Assistance- State Board of Education Linda Champion Deputy Commissioner, Finance and Operations
2010-11 Budget Request for the Division of Vocational Rehabilitation Requested increase in General Revenue funds for Purchased Client Services will allow the department to maximize the available federal funds.
2010-11 Division of Blind Services Total Funding $61,677,861 • $44,642 increase to serve an additional 34 children enrolled in the Blind Babies program • $901,030 increase in state funds to match available federal dollars
Student Financial Assistance 2010-11 Proposed Budget for the Three Largest Programs *Student Financial Aid Amount includes FSAG amount on following line.
2010-11 K-20 Operating Budget Request *Excludes Universities and Board of Governors
2010-11 Fixed Capital Outlay Legislative Budget Request Linda Champion Deputy Commissioner, Finance and Operations
2010-11 Public Education Capital OutlayLegislative Budget Request Total Appropriation $161,900,000 Less off-the-top projects $6,944,856
Summary of 2010-11 FCO Request *Includes debt service amount for University System Capital Improvement Fee Bonds
2010-11 K-20 Education Operating and Fixed Capital Outlay Budget Request • VPK Early Learning - $390,152,790 • K-12 - $13,966,995,248 • Workforce Education – $540,127,070 • Florida Colleges - $1,186,402,515 • Student Financial Aid - $606,579,647 • Other Education - $629,387,443 • State Board of Education - $225,052,661 • Vocational Rehabilitation - $226,381,446 • Blind Services - $61,677,861 • Private Colleges & Universities - $116,275,475 • Fixed Capital Outlay – $1,952,107,346 *includes BOG items • Total - $19,271,752,059 *Excludes operating budget for State University Systems and Board of Governors
2010-11 K-20 Education Operating and Fixed Capital Outlay Budget Request
2010-2011 Legislative Budget Request Kristie Harris, Board of Governors Director, Budget and Fiscal Policy
SUS At A Glance UWF FSU UNF FAMU • 11 Institutions • 302,513 Students (Fall 2008) • 71% Full-time; 29% Part-time • 61,178 Personnel (Fall 2008) • 70,659 Degrees Awarded (2007-08) • 31,362 Acres • 3,643 Facilities • 77.6 Million Gross Square Feet • $2.0 Billion State Operating Budget • $1.6 Billion in Research Contracts UF UCF USF NCF Main Campus Branch Campus FAU FGCU FIU