Download
1 / 49
490 likes | 839 Views
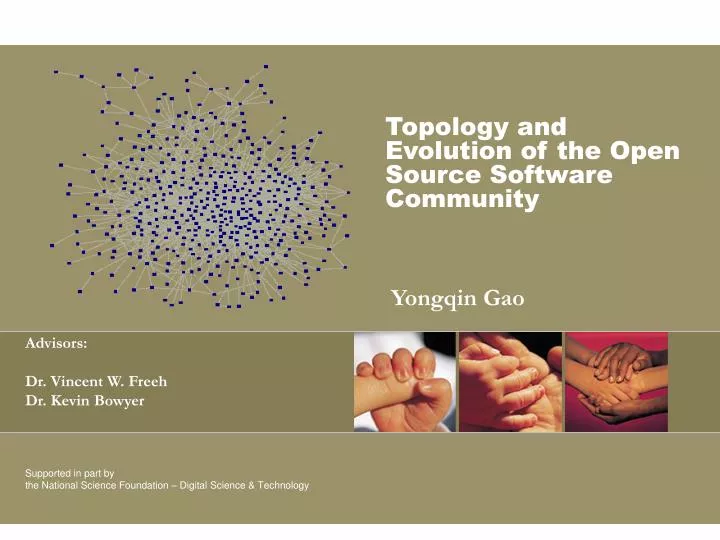
Topology and Evolution of the Open Source Software Community Yongqin Gao Advisors: Dr. Vincent W. Freeh Dr. Kevin Bowyer Supported in part by the National Science Foundation – Digital Science & Technology Outline Overview Data collection Network modeling

E N D
Topology and Evolution of the Open Source Software Community Yongqin Gao Advisors: Dr. Vincent W. Freeh Dr. Kevin Bowyer Supported in part by the National Science Foundation – Digital Science & Technology
Outline • Overview • Data collection • Network modeling • Topological statistical analysis (real data) • Simulations • Publications • Conclusions
Overview (about OSS) • What is OSS • Free to use, free to distribute • Unlimited user and usage • Source code available and modifiable • Potential advantages over commercial software • Higher quality • Faster development • Lower cost • Transparent
Overview (about our research) • Our goal • Understanding the OSS phenomenon • Approach • SourceForge is the source of our empirical data • Modeling as a social network • Analysis of topological statistics • Use simulation to verify and validate the model
Outline • Overview • Data collection • Network modeling • Topological statistical analysis • Simulations • Publications • Conclusions
Data Collection — Monthly • Web crawler (scripts) • Python • Shell • AWK • Sed • Monthly • Since Jan 2001 • ProjectID • DeveloperID • Almost 2 million records • Relational database PROJ|DEVELOPER 8001|dev348 8001|dev8972 8001|dev9922 8002|dev27650 8005|dev31351 8006|dev12409 8007|dev19935 8007|dev4262 8007|dev36711 8008|dev8972
Outline • Overview • Data collection • Network modeling • Topological statistical analysis (real data) • Simulations • Publications • Conclusions
Modeling as Collaboration Network • What is a collaboration network? • A social network representing the collaborating relationships. • Movie actor network and scientist collaboration network • Difference of SourceForge collaboration network • Link detachment • Virtual collaboration • Voluntary • Global • Bipartite property of collaboration networks
Collaboration network - bipartite Adapted from Newman, Strogatz and Watts, 2001
dev[72] dev[67] dev[52] dev[65] dev[70] dev[57] 7597 dev[46] 6882 dev[47] dev[45] dev[64] dev[99] 7597 dev[46] 7597 dev[46] dev[52] dev[72] dev[67] 7597 dev[46] dev[47] 6882 dev[47] dev[55] dev[55] dev[55] 7597 dev[46] 7028 dev[46] dev[70] 7597 dev[46] 7028 dev[46] dev[57] dev[45] dev[51] dev[99] 7597 dev[46] 7028 dev[46] 6882 dev[47] 6882 dev[58] dev[61] dev[51] dev[79] dev[47] dev[58] 7597 dev[46] dev[58] dev[46] 9859 dev[46] dev[54] 15850 dev[46] dev[58] 9859 dev[46] dev[79] Dev[80] 9859 dev[46] dev[49] dev[53] 9859 dev[46] 15850 dev[46] dev[59] dev[56] 15850 dev[46] dev[83] 15850 dev[46] dev[48] dev[53] dev[56] dev[83] dev[48] SourceForge Developer Network OSS Developer Network (Part) Project 7597 Developers are nodes / Projects are links 24 Developers dev[64] 5 Projects 2 hub Developers Project 6882 1 Cluster Project 7028 dev[61] dev[54] dev[49] dev[59] Project 9859 Project 15850
Outline • Overview • Data collection • Network modeling • Topological statistical analysis (real data) • Simulations • Publications • Conclusion
Topological Analysis • Statistics inspected • Diameter • Average degree • Clustering coefficient • Degree distribution • Cluster size distribution • Relative size of major cluster • Fitness and life cycle • Evolution of these statistics • Dual networks • developer network and project network
Terminology • Diameter • Average length of shortest paths between all pairs of vertices • Degree • The count of edges connected to given vertex • Average degree • Average of the degrees of all vertices in the network • Cluster • The connected components of the network • Clustering coefficient (CC) • CCi: Fraction representing the number of links actually present relative to the total possible number of links among the vertices in its neighborhood. • CC: average of all CCi in a network • Degree distribution • The distribution of degrees throughout a network • Major cluster • The largest cluster in the network
Diameter of Developer Network vs. Time • Network size increased from 30,000 to 70,000
Diameter of Project Network vs. Time • Network size increased from 20,000 to 50,000. • Diameter decreasing with time both for developer network and project network
Cluster Size Distribution • R2 with major cluster is 0.7426 • R2 without major cluster is 0.9799
Relative Size of Major Cluster vs. Time • Increase of the relative size of the major cluster • Increasing rate is decreasing • May be an indication of the network evolution
Existence of Fitness • Investigation of development of single project can verify the existence of “newcomer” phenomenon • We tracked the development of every new project in July 2001 until now (total 1660 projects) • Maximal monthly growth per project is 13 while average monthly growth per project is just 0.3639
Summary of Results • Power law rules • Degree distributions, cluster distribution • Average degree increasing with time • Diameter decreasing with time • Clustering coefficient decreasing with time • Fitness existed in SourceForge • Projects have life cycle behaviors
Outline • Overview • Data collection • Network modeling • Topological statistical analysis (real data) • Simulations • Publications • Conclusion
Agent-based Modeling • EBM vs. ABM • Heterogeneous individuals • Complex network • Experience environment • Hardware: computer cluster • Software: • Simulation toolkits: Swarm • Database: Oracle • Language: Java, PL/SQL
Model for SourceForge • ABM based on bipartite graph • Model description • Agent: developer • Behaviors: Create, join, abandon and idle • Preference: developer’s and project’s • Fitness • Four models in iterations • ER, BA, BA with constant fitness and BA with dynamic fitness • Comparison of empirical and simulated data
ER Model - Diameter • Average degree is decreasing while it is increasing in empirical data • Diameter is increasing while it is decreasing in empirical data
ER Model – Clustering Coefficient • Clustering coefficient is relatively low under 0.3 while it is around 0.7 in empirical data.
ER Model – Degree Distribution • Degree distribution is normal distribution while it is power law in empirical data
ER Model – Cluster Size Distribution • power law distribution with R2 as 0.6667 (0.9653 without the major cluster) while R2 in empirical data is 0.7426 (0.9799 without the major cluster) • The actual distribution is different from empirical data
BA Model – Diameter and Clustering Coefficient • Small diameter and high clustering coefficient like empirical data • Diameter and clustering coefficient are both decreasing like empirical data
BA Model – Degree Distribution • Power laws in degree distributions, similar to empirical data (o for simulated data and x for empirical data). • For developer distribution: simulated data has R2 as 0.9798 and empirical data has R2 as 0.9714. • For project distribution: simulated data has R2 as 0.6650 and empirical data has R2 as 0.9838.
BA Model with Constant Fitness • Power laws in degree distributions, similar to empirical data (o for simulated data and x for empirical data). • For developer distribution: simulated data has R2 as 0.9742 and empirical data has R2 as 0.9714. • For project distribution: simulated data has R2 as 0.7253 and empirical data has R2 as 0.9838.
BA Model with Dynamic Fitness • Power laws in degree distribution, similar to empirical data (o for simulated data and x for empirical data). • For developer distribution: simulated data has R2 as 0.9695 and empirical data has R2 as 0.9714. • For project distribution: simulated data has R2 as 0.8051 and empirical data has R2 as 0.9838.
Advantage of Dynamic Fitness • Intuition: Fitness should decreasing with time. • Statistics: project has life cycle behavior which can not be replicated by BA model with constant fitness but can be replicated by BA model with dynamic fitness
Summary of Results • We use ABM to model and simulate the SourceForge collaboration network. • Conceptual framework is proposed for agent-based modeling and simulation. • Case study of this framework: SourceForge study through ER, BA, BA with constant fitness and BA with dynamic fitness.
Outline • Overview • Data collection • Network modeling • Topological statistical analysis (real data) • Simulations • Publications • Conclusion
Publications To-date • Yongqin Gao, "Modeling and Simulation of the OSS Community", Seventh Annual Swarm Researchers Meeting (Swarm2003), Notre Dame, IN, 2003. • Yongqin Gao, Vince Freeh, and Greg Madey, "Analysis and Modeling of the Open Source Software Community", NAACSOS Conference 2003, Pittsburgh. • Yongqin Gao, Vince Freeh, and Greg Madey, "Conceptual Framework for Agent-based Modeling and Simulation", NAACSOS Conference 2003, Pittsburgh. • Greg Madey, Vincent Freeh, Renee Tynan, Yongqin Gao, Chris Hoffman, "Agent-based Modeling and Simulation of Collaborative Social Networks", AMCIS 2003, Tampa, FL.
Possible Journals • Chapter 3 • Physica A: statistical mechanics and its applications • Journal of Social Structure (JSS) • Chapter 4 • Journal of Artificial Societies and Social Simulation (JASSS) • Journal of Statistical Computation and Simulation (JSCS)
Outline • Overview • Data collection • Network modeling • Topological statistical analysis (real data) • Simulations • Publications • Conclusion
Conclusion • Study of SourceForge collaboration network can help us understanding the OSS community • We investigate not only the topological statistics but also the evolution of these statistics. • Simulation is used to investigate of SourceForge collaboration network.
Contribution • Statistical study of the SourceForge community (snapshot and evolution) • Verification of the approximate method to calculate the diameter and CC • Proposal of a model for the SourceForge community • Improvement of dynamic fitness to BA model
Future Work • Data collection • Database dump from SourceForge (PostgreSQL 8GB) • All the possible attributes • Database schema in UML • More topology analysis (with more attributes) • Discussion forum • Task assignment • Project management • Active testing • Behavior-based analysis • Interaction between agents • H. Beyton Young’s model • Information entropy analysis
Acknowledgements • Committee • Advisors • Colleagues • SourceForge • NSF • Others