Download
1 / 9
90 likes | 116 Views
Three simple and sensitive methods, namely, difference spectrophotometric, colorimetric and HPLC methods are<br>described for the determination of epinastine hydrochloride (EPH) in pure form and ophthalmic solution. First, the<br>drug is determined quantitatively by pH-induced difference spectrophotometry. The method is based on the<br>measurement of the difference absorbance at 252nm of epinastine hydrochloride (EPH) in 0.1N NaOH against<br>equivalent amount in 0.1N HCl as a blank. Beer's law was obeyed for the studied drug over the range of 16 to 96<br>µg.ml -1. In the second method, the drug is converted to its corresponding free base which is treated with chloranilic<br>acid (CAA) solution in acetonitrile to give a colored product with an absorption maximum at 517 nm. Various<br>experimental parameters and the stoichiometry of the reaction were investigated and optimized. Linearity is obeyed<br>over the range of 20-220 µg.ml -1. The third is an HPLC method, which is developed for the determination of EPH<br>using acetonitrile: 0.1 M ammonium acetate buffer (40:60 v/v) as a mobile phase at a flow rate 1 ml/min and UV<br>detection at 262nm. Methyl paraben was used as internal standard. The linearity range was from 20 to 100 µg.ml -1<br>.<br>The proposed methods were validated according to the guidelines of the ICH and were also statistically compared<br>with the reference method showing no significant difference concerning accuracy and precision. <br>

E N D
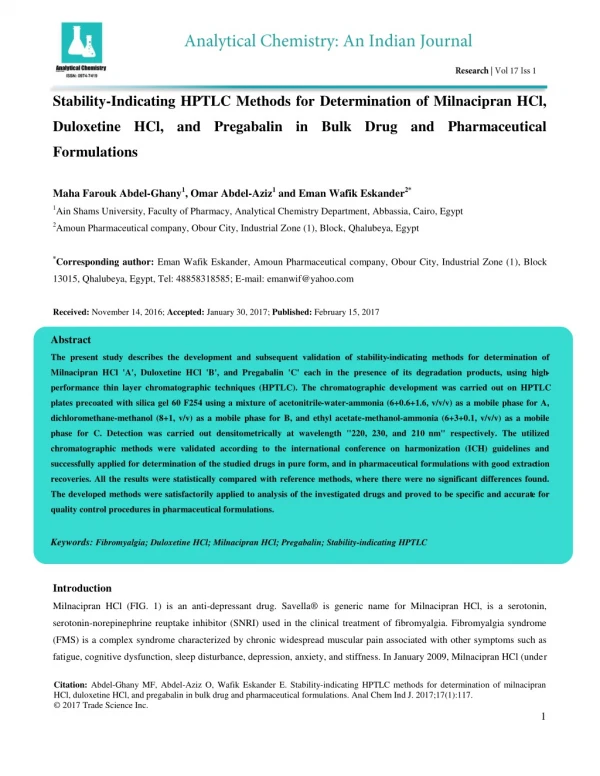
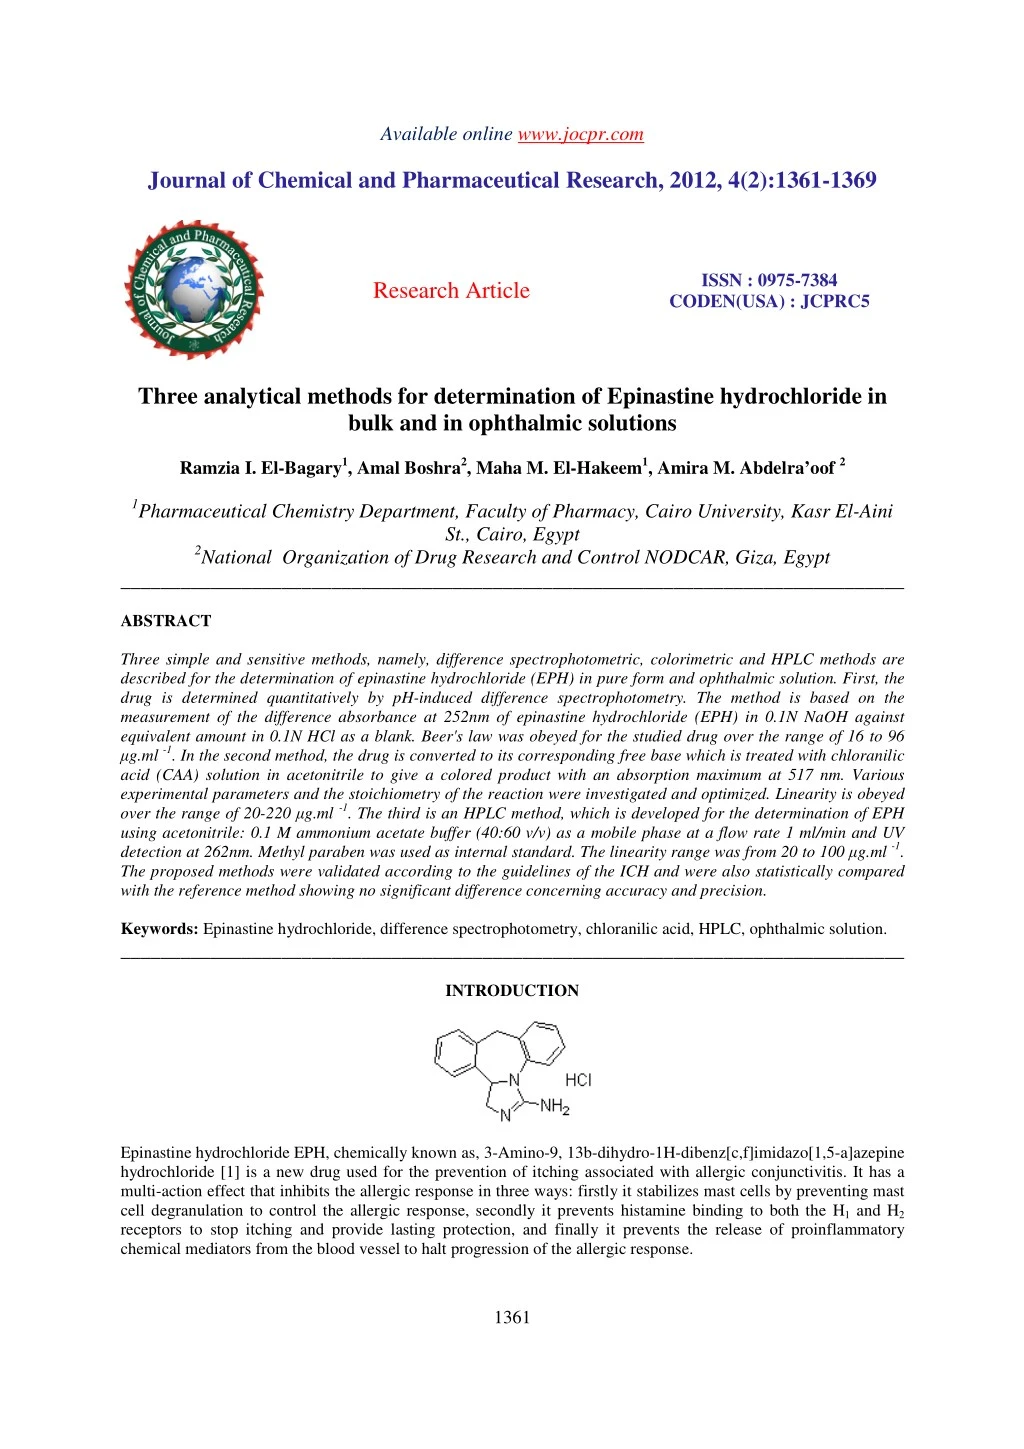
Available online www.jocpr.com Journal of Chemical and Pharmaceutical Research, 2012, 4(2):1361-1369 ISSN : 0975-7384 CODEN(USA) : JCPRC5 Research Article Three analytical methods for determination of Epinastine hydrochloride in bulk and in ophthalmic solutions Ramzia I. El-Bagary1, Amal Boshra2, Maha M. El-Hakeem1, Amira M. Abdelra’oof 2 1Pharmaceutical Chemistry Department, Faculty of Pharmacy, Cairo University, Kasr El-Aini St., Cairo, Egypt 2National Organization of Drug Research and Control NODCAR, Giza, Egypt ______________________________________________________________________________ ABSTRACT Three simple and sensitive methods, namely, difference spectrophotometric, colorimetric and HPLC methods are described for the determination of epinastine hydrochloride (EPH) in pure form and ophthalmic solution. First, the drug is determined quantitatively by pH-induced difference spectrophotometry. The method is based on the measurement of the difference absorbance at 252nm of epinastine hydrochloride (EPH) in 0.1N NaOH against equivalent amount in 0.1N HCl as a blank. Beer's law was obeyed for the studied drug over the range of 16 to 96 µg.ml -1. In the second method, the drug is converted to its corresponding free base which is treated with chloranilic acid (CAA) solution in acetonitrile to give a colored product with an absorption maximum at 517 nm. Various experimental parameters and the stoichiometry of the reaction were investigated and optimized. Linearity is obeyed over the range of 20-220 µg.ml -1. The third is an HPLC method, which is developed for the determination of EPH using acetonitrile: 0.1 M ammonium acetate buffer (40:60 v/v) as a mobile phase at a flow rate 1 ml/min and UV detection at 262nm. Methyl paraben was used as internal standard. The linearity range was from 20 to 100 µg.ml -1. The proposed methods were validated according to the guidelines of the ICH and were also statistically compared with the reference method showing no significant difference concerning accuracy and precision. Keywords: Epinastine hydrochloride, difference spectrophotometry, chloranilic acid, HPLC, ophthalmic solution. ______________________________________________________________________________ INTRODUCTION Epinastine hydrochloride EPH, chemically known as, 3-Amino-9, 13b-dihydro-1H-dibenz[c,f]imidazo[1,5-a]azepine hydrochloride [1] is a new drug used for the prevention of itching associated with allergic conjunctivitis. It has a multi-action effect that inhibits the allergic response in three ways: firstly it stabilizes mast cells by preventing mast cell degranulation to control the allergic response, secondly it prevents histamine binding to both the H1 and H2 receptors to stop itching and provide lasting protection, and finally it prevents the release of proinflammatory chemical mediators from the blood vessel to halt progression of the allergic response. 1361
Ramzia I. El-Bagaryet al ______________________________________________________________________________ J. Chem. Pharm. Res., 2012, 4(2):1361-1369 Few analytical methods were reported for the estimation of epinastine hydrochloride including HPLC [2,3,and4] and derivative spectrophotometry [4] while epinastine hydrobromide was quantitatively assayed by potentiometric method [5]. The present study describes two spectrophotometric methods, namely difference spectrophotometry and colorimetry, in addition to HPLC method for the estimation of epinastine hydrochloride (EPH) in bulk and in its pharmaceutical formulation. EXPERIMENTAL SECTION 2.1. Instrumentation: For difference method: analysis was carried out on a Shimadzu 1650 PC (Japan) double beam uv-vis spectrophotometer connected to IBM compatible computer and HP laser jet 1018 printer. The software used was UVPC personal spectroscopy software version 3.7(Shimadzu) with matched quartz cells of 1 cm path length .The spectral band width was 2nm and the wavelength scanning speed was fast. For colorimetric method: measurements were performed using Labomed spectro UV-Vis double beam, scanning auto cell, labomed INC(USA), serial number 001168. For HPLC: a chromatographic system consisting of Agilent 1100 HPLC instrument, consisting of isocratic pump, an ultraviolet variable wavelength detector, an autosampler injector, lichrocart 10 µm C18 column (250 mm×4.6mm), degasser G1322A (S.N.JP05034185), quaternary pump G1311A (S.N.DE14919061), ALS G1313A, (S.N.DE14919455), Col Com G1316A (S.N.DE14928048), VWD G1314A(S.N.JP20217955). 2.2. Standards and reagents: All chemicals and reagents used were of analytical or HPLC grade. Epinastine hydrochloride EPH was kindly supplied by Allergan Company (purity 100.31% by HPLC reference method ) [6]. Relestat eye drops (0.5mg/ml) (Batch No. E54531), manufactured by Allergen Company was purchased from the market. Each ml contains 0.5 mg Epinastine HCl. Chloranilic acid solution CAA in acetonitrile (1800 µg.ml-1) (Sigma-Aldrich), Methanol HPLC grade(lab scan), HCl (0.1N in distilled water), NaOH (0.1N in distilled water), acetonitrile HPLC grade(lab scan), Na2CO3 solution (10%in distilled water), chloroform HPLC grade, ammonium acetate (0.1 M in distilled water), methylparaben supplied by Pharonia company( purity 98.42%) [7] as internal standard for HPLC method. 2.3. Chromatographic conditions: Chromatographic separation was carried out on C18 column lichrocart 10 µm (250 mm×4.6mm). Isocratic elution was carried out using acetonitrile: 0.1M ammonium acetate buffer (40:60 v/v) at a flow rate 1 ml/min and uv detection at 262nm. The injection volume was 20 µl. The column was maintained at ambient temperature. The mobile phase was filtered through 0.45µm Teflon membrane filter and degassed for about 15 min in ultrasonic bath prior to use. To reach good equilibrium , the analysis was performed after passing about 50-60ml of the mobile phase, just for conditioning and pre-washing of the stationary phase. 2.4. Preparation of standard stock solutions: a-For difference method: A stock standard solution of EPH (0.4mg. ml -1) in methanol was prepared. b-For colorimetric method: An accurate weight of EPH ( 50mg) was dissolved in distilled water in a 50ml measuring flask and transferred into a separating funnel, where 25ml of 10%Na2CO3 solution were added. The mixture was mixed and extracted three times each with 25ml CHCl3 , then the chloroformic layer was evaporated to dryness where the obtained residue was dissolved quantitatively in 50ml methanol (final conc. 1mg. ml -1). c- For HPLC method: EPH standard stock solution (1 mg .ml -1) in methanol and methyl paraben (0.1 mg. ml -1) in methanol as internal standard stock solution. 2.5. General procedure and Linearity: a-For difference method: Working standard solutions with concentration ranging from (16- 96 µg.ml -1) were prepared by transferring appropriate volumes of EPH standard stock solution into two series of 5 ml volumetric flasks in duplicate. The 1362
Ramzia I. El-Bagaryet al ______________________________________________________________________________ J. Chem. Pharm. Res., 2012, 4(2):1361-1369 volume of each flask in the first series was adjusted with 0.1N HCl and for the second series was adjusted with 0.1N NaOH to give two series of equimolar solutions of EPH in two different pH media. Difference spectra were obtained by scanning the acidic solution (in 0.1N HCl) in the reference cell and the basic solution (in 0.1N NaOH) in the sample cell. The values of absorbance difference at 252 nm were recorded and plotted versus the corresponding concentrations (µg. ml -1) of the drug to construct the calibration curve and to obtain the regression equation (1)which is stated in Table (2). b- For colorimetric method: Preparation of working standard solutions ranging from (20 to 220 µg.ml -1) of EPH was carried out by introducing accurately measured aliquots equivalent to (0.1-1.1mg)of EPH from its standard stock solution (1mg.ml -1) into a series of 5 ml volumetric flasks, followed by 1ml of CAA solution then the volume was completed with acetonitrile and mixed well. The absorbance at 517nm of the observed color were recorded for each flask against its corresponding blank and plotted versus the corresponding concentrations(µg. ml -1) of the drug to construct the calibration curve and to obtain the regression equation (2)which is stated in Table (2). c-For HPLC method: Appropriate aliquots of EPH standard stock solution (1 mg.ml -1) were transferred into a series of 10 ml volumetric flasks, 0.1 ml of methyl paraben internal standard solution was added to each flask , then the volume of each flask was diluted with methanol to obtain working standard solutions ranging from (20-100 mg.ml -1). Twenty µl triplicate injections of each working standard solution were injected into the chromatographic system using a lichrocart 10 µm C18 column. The elution was carried out using acetonitrile: 0.1M ammonium acetate buffer (40:60 v/v) at a flow rate 1 ml/min and uv detection at 262nm. The chromatograms were developed and the ratios of the peak areas of EPH to those of internal standard were recorded for each concentration of drug solution. The calibration graph was obtained by plotting the relative peak area ratios versus the corresponding concentrations (µg. ml -1) of the drug to construct the calibration curve and to obtain the regression equation (3) which is stated in Table (2). 2.6. Determination of EPH in “Relestat” eye drops: a-Difference method: Four ml aliquot of the eye drop solution (containing 2000µg of EPH) was diluted with methanol in a 10 ml volumetric flask to get a final concentration of 200µg.ml -1 . Different aliquots equivalent to (30-70 µg.ml -1) were treated as previously mentioned under general procedure and linearity. The same procedure was repeated applying the standard addition technique. The absorbance difference (∆A) at 252nm were used to calculate the concentration of eye drops solution and the added authentic using eq.(1). b-For colorimetric method: Twenty ml aliquot of ”Relestat” eye drops was shaken in a separating funnel with 10 ml of 10% Na2 CO3 solution then extracted three times each with 25 ml of chloroform. The collected chloroformic extracts were evaporated and the residue was dissolved quantitatively in methanol to 10 ml volume (final concentration 1 mg.ml -1). Different aliquots equivalent to (20-140 µg.ml -1) were treated as previously mentioned under general procedure and linearity. The same procedure was repeated applying the standard addition technique. The absorbance at 517nm was used to calculate the concentration of eye drops solution and the added authentic using eq.(2). c-For HPLC method: An aliquot of the eye drop solution was diluted with methanol to get a solution of 1 mg. ml -1 of EPH. Different aliquots equivalent to (20-70 µg.ml -1) were treated as previously mentioned under general procedure and linearity. The same procedure was repeated applying the standard addition technique. The detection at 262nm was used to calculate the concentration of eye drops solution and the added authentic using eq.(3). 1363
Ramzia I. El-Bagaryet al ______________________________________________________________________________ J. Chem. Pharm. Res., 2012, 4(2):1361-1369 Table (1): Optimum assay parameters for the three proposed analytical methods of EPH Parameters Difference method -Wavelength range: 400-200 nm. -Recording range: 0 to 2. -spectral band width: 2nm -Sampling interval: auto -Scanning speed: fast Wavelength of measurement (nm) Colorimetric method HPLC method -Wavelength range: 800-200 nm -Ordinate range limit: 0 to 2. -scanning speed: fast Instrumental parameters 252 517 262 -Time of reaction: 0 min -Stability of the color: 30 min -Drug: Reagent volume ratio : 1:6 -Solvent used: methanol mixture. -Stationary phase: lichrocart 10 µm C18 column -Flow rate: 1 ml/min -Mobile phase: acetonitrile:0.1 M ammonium acetate buffer(40:60 v/v) Optimized parameters experimental acetonitrile- RESULTS AND DISCUSSION 3.1. For Difference method: This work describes a simple pH-induced difference spectrophotometric method for the determination of EPH in eye drops. The absorbance spectra of equimolar solutions of EPH in 0.1 N HCl and 0.1 N NaOH, are shown in fig. (1). Fig. (1). Absorption spectra of equimolar solution of EPH (96 µg.ml-1) in 0.1 N NaOH alone (____) , in 0.1 N HCl (------) alone and the difference absorption spectrum of equimolar solution of EPH ( 96µg.ml-1)in 0.1 N NaOH vs 0.1 N HCl (……….). Fig.(1) shows the difference absorption spectrum of EPH solution in 0.1 N NaOH (in sample cell) against its equimolar solution in 0.1 N HCl (in reference cell) where it was found that measurements of absorbance difference at 252 nm were quantitatively proportional to EPH concentration. A plot of absorbance difference values versus EPH concentration was found to be linear over the concentration range of (16-96 µg.ml-1 ,r2= 0.9994). The limit of detection (LOD) and limit of quantitation (LOQ) were calculated and described in Table (2). The obtained spectra of the eye drops solution were compared to those of the standard drug where both spectra were found to be identical. Difference spectrophotometric method was applied to estimate the concentration of EPH in bulk and in “Relestat”eye drops applying the standard addition technique and the obtained results were recorded in Tables (3,8). 3.2. For colorimetric method: EPH solution in methanol shows an absorption band at 262 nm as shown in Fig. (2) while CAA in acetonitrile solution gives a prominent peak at 439 nm. However, on reaction of both compounds, a new absorption peak is formed at 517 nm as shown in Fig. (2) as a result of the formation of charge-transfer complex. This colorimetric method is based on the determination of EPH through the formation of a charge-transfer complex between chloranilic acid which reacts as a Π-acceptor and the studied drug as n-donor in an (acetonitrile-methanol mixture) as shown in Fig.(3). EPH contains two aromatic rings that serve as n-electron donor moieties. 1364
Ramzia I. El-Bagaryet al ______________________________________________________________________________ J. Chem. Pharm. Res., 2012, 4(2):1361-1369 Fig.(2)Absorption spectra of EPH in methanol (20 µg.ml-1) ( ______), CAA solution in aceotnitrile (360 µg.ml- 1) (--------) , and CT complex in methanol-acetonitrile mixture (……….).. The proposed scheme of reaction is as follows. Fig.(3): The proposed scheme of reaction . The choice of solvent, the stability of the complexes formed and other various experimental parameters were investigated. The stoichiometry of the reaction was studied by Job's method of continuous variation [8] and it was revealed that the interaction occurs in the mole ratio of 1:4 (donor: acceptor). CAA solution in various solvents failed to give quantitative results. However, CAA in acetonitrile reacted stoichiometrically forming a purple chloranilic acid radical anion. Acetonitrile proved to be the most suitable diluting solvent as it gives good solvating capacity for CAA, and gives the highest yield of the radical anion. Other solvents such as chloroform, 2-propanol, methanol, ethanol were tried and found to be not suitable, because the complex formed in these solvents either had low absorbance or was precipitated on dilution. The optimum volume ratio of drug: reagent for complete reaction was found to be 1:6. The reaction between the drug and CAA in acetonitrile was instantaneous and the product remained stable for at least 30 minutes. The optimized parameters are listed in Table (1). 3.3. For HPLC method: HPLC has become a widely used tool for the routine analysis and separation of drugs either alone in pure form [9], or in admixture with other drugs [10,11] or degradation products [11-13] and in pharmaceutical formulations [9-13]. Different types of stationary phase columns such as C8 and C18 columns with different dimensions and particle sizes were tried for example, Agilent C8 zorbax, Agilent C18 zorbax, Agilent C8 Eclipse and Agilent C18 Eclipse columns, to obtain the best stationary-mobile phase match. It was clearly found that C18 Lichrocart showed the most suitable resolution for quantification of EPH and its internal standard. Different mobile phases with different buffers and organic modifiers including acetonitrile and methanol have been tested for optimizing the HPLC separation. The mobile phase selection was based on peak parameters (symmetry, tailing), run time, ease of preparation and cost. It was found that the mobile phase consisting of 0.1M ammonium acetate: acetonitrile in the ratio of 60:40 flowing at 1ml/min was quite satisfactory for the good resolution and determination of the studied drug in the presence of the internal standard. Any decrease in the ratio of ammonium acetate buffer or increase in flow rate leads to bad resolution between peaks. 1365
Ramzia I. El-Bagaryet al ______________________________________________________________________________ J. Chem. Pharm. Res., 2012, 4(2):1361-1369 For the determination of the optimum UV detector wavelength, variable wavelength values were set for detection of the eluted drug and its internal standard. The optimum wavelength with ideal sensitivity and low noise was found to be 262 nm . An accurate aliquot (0.2 ml) of EPH standard stock solution was transferred into a 10 ml volumetric flask followed by 0.1 ml of methylparaben standard tock solution then the volume was completed with methanol. When 20 µl aliquot of this mixture solution was subjected to the previously mentioned chromatographic conditions, a typical chromatogram of both compounds in Fig (4) showing well resolved peaks of EPH at 4.004 min and its internal standard at 5.309 min. The total run time for a complete quantification of the drug and its internal standard was about 6.5 min. Fig.(4): HPLC chromatogram of EPH (20 µg.ml-1) and methyl paraben (1 µg.ml-1) 3.4.Method validation : The proposed methods of analysis were validated as per the recommendations of ICH (IQ1,IQ2)[14] for the parameters like accuracy, linearity, precision, specificity, detection limit and quantitation limit. The regression analysis for the three proposed methods using the method of least squares was applied for the slope (a) and the intercept (b) where results are summarized in Table (2). Table (2): Method validation and analytical parameters obtained by the proposed methods Parameters Difference method Linearity range (µg.ml-1) 16-96 Regression equation *: Intercept (a) Slope (b) 0.0096 Limit of detection (LOD) 1.31 Limit of quantitation(LOQ) 3.96 SD of slope Sb 0.000061 SD of intercept Sa 0.0038 Correlation coefficient, r 0.9994 Confidence limit of intercept ** -0.0191±0.008103 Confidence limit of slope** 0.0096±0.0001299 *is regression equation: Y= a + bX , where Y is the measured response , X is the concentration of the drug (µg.ml-1) ** 95% confidence level. 3.4.1.Linearity and Range: Linearitywas established by performing the proposed methods using a minimum of six concentrations on three different days. Linear relationships were observed over the concentration ranges of EPH stated in Table (2). 3.4.2. Accuracy & Precision: Accuracy of the methods was determined by performing recovery studies via the standard addition technique in which pre-analyzed samples were taken and known quantities of standard EPH were added. Results are shown in Table (3). Interday & Intraday precisions were performed at three concentrations levels (32, 64, 96 µg.ml-1) for difference method, (40,100,160 µg.ml-1)for colorimetric method and (30,50,70 µg.ml-1) for HPLCanalysis. The determinations Colorimetric method 20-220 Y=0.0046X+0.0257 Eq.(2) +0.0257. 0.0046 3.25 9.84 0.0000082 0.004528 0.9992 0.0257±0.009645 0.0046±0.0000174 HPLC method 20-100 Y=0.0249X-0.0221 Eq.(3) -0.0221. 0.0249 0.76 2.32 0.0000226 0.0576444 0.9998 0.0221±0.122782 0.0249±0.000048 Y=0.0096X-0.0191 Eq.(1) -0.0191 1366
Ramzia I. El-Bagaryet al ______________________________________________________________________________ J. Chem. Pharm. Res., 2012, 4(2):1361-1369 were repeated three times in a day and on three different days at each concentration level as shown in tabulated results in Tables (4-6). Table (3): Results of determination of EPH in “Relestat” eyedrops Difference method Colorimetric method Labeled amount Added standard Labeled amount Mean 99.94 99.61 99.47 ±SD 0.73 1.19 1.09 ± SE 0.37 0.42 0.54 RSD% 0.73 1.20 1.09 Table (4): Assessment of accuracy and repeatability of the difference method Concentration of EPH (µg.ml-1) recovery% recovery% 32 101.37 0.12 101.40 64 99.28 0.05 99.53 96 100.95 0.02 99.56 *n=3x3=9 , regression equation: Y= 0.0096 X – 0.0191 Table (5): Assessment of accuracy and repeatability of the colorimetric method Concentration of EPH (µg.ml-1) recovery% recovery% 40 100.70 0.27 99.08 100 101.59 1.41 100.93 160 100.14 0.13 101.94 *n=3x3=9 , regression equation: Y= 0.0046 X + 0.0257 Table (6): Assessment of accuracy and repeatability of the HPLC method Concentration of EPH (µg.ml-1) recovery% recovery% 30 101.22 0.41 101.62 50 101.37 1.10 100.17 70 10.75 0.09 100.64 *n=3x3=9 , regression equation: Y= 0.0249 X – 0.0221 3.4.3. LOD and LOQ The calculated LOD and LOQ values, listed in Table (2), confirmed good sensitivity for the proposed methods and consequently their capability to determine low amounts of the investigated drug. 3.4.4. System suitability for HPLC: System suitability test parameters were calculated under the optimized experimental conditions. EPH and the internal standard could be successfully eluted in the form of symmetrical peaks quite away from each other. The retention time values of the peaks together with other chromatographic parameters are collected in Table (7) .The table describes the calculated resolution value(Rs) as well as selectivity factor(α)which insures complete or 100% separation of the compounds under investigation. The Tailing factor of the drug peak also revealed linear isotherm peak elution without tailing. 3.2.5. Specificity for HPLC: Specificity is the ability of proposed method to accurately measure the analyte response in the presence of all potential sample components. Complete separation and resolution of internal standard from EPH with good peak shapes and without any apparent shoulders confirm specificity of the method (HPLC chromatogram in Fig (4). HPLC method Parameters Labeled amount 100.46 1.26 0.36 1.25 Added standard 98.90 0.80 0.40 0.80 Labeled amount 99.98 1.12 0.35 1.12 Day 1* Day 2* Day 3* Interday statistics Mean recovery% 101.37 99.66 100.31 Mean Mean Mean recovery% 101.33 100.16 100.41 RSD% RSD% RSD% RSD% 0.08 0.05 0.34 0.07 0.05 0.23 0.09 0.05 0.20 Day 1* Day 2* Day 3* Interday statistics Mean Mean Mean recovery% 0.00 0.21 0.00 Mean recovery% 0.28 1.11 0.13 RSD% RSD% RSD% 0.28 1.71 0.13 99.62 99.84 101.53 99.80 100.79 101.20 Day 1* Day 2* Day 3* Interday statistics Mean Mean Mean recovery% 0.57 0.08 0.66 Mean recovery% 0.38 0.65 0.48 RSD% RSD% RSD% 0.16 0.76 0.70 100.01 99.93 100.98 100.95 100.49 100.79 1367
Ramzia I. El-Bagaryet al ______________________________________________________________________________ J. Chem. Pharm. Res., 2012, 4(2):1361-1369 Moreover, recovery results of “Relestat“ eye drops by the proposed methods shown in Table (4) indicated the absence of interferences from the commonly encountered pharmaceutical additives in ophthalmic solutions such as benzalkonium chloride, disodium edetate, sodium chloride, sodium dihydrogen phosphate dihydrate, sodium hydroxide/hydrochloric acid(to adjust pH). Table (7): System suitability report of HPLC method Capacity factor a EPH 1.83 1.51 0.80 Methylparaben 2.76 0.92 Reference value symmetric peak a is number of samples analyzed is three The results obtained by the proposed methods were statistically compared with reference method concerning (t-test) and (F-test) values showing no significant difference between the proposed methods and the reference method as shown in Table (8). Table (8): Statistical analysis of the results obtained by the proposed methods and the reference HPLC method for EPH in bulk Parameters Difference method Colorimetric method Mean 100.12 100.91 ± SD 0.74 1.09 ± SE 1.65 0.49 N 5 5 Variance 2.71 1.20 “t” value 0.30(1.86)* 0.87(1.86)* “F” value 3.71(6.39)* 1.64(6.39)* *Figures in parenthesis are the corresponding theoretical t- and F-values at P=0.05 **Reference method for EPH using HPLC method[6]. CONCLUSION In this study, difference, colorimetric in addition to HPLC methods were developed and validated for the quantitative estimation of EPH in bulk and in “Relestat”eye drops. There was no interference from additives commonly found in eye drops dosage forms. The statistical parameters clearly indicate the reproducibility and accuracy of the methods. The proposed methods were found to be simple, precise and rapid so they could be adapted for both quality control and routine determination of EPH. REFERENCES [1](http://www.medicineonline.com/drugs/e/1552/ELESTAT-epinastine-HCl-ophthalmic-solution-0-05Sterile.html) [2]Saleh ,Ola.A., El-Azzouny, Aida.A., Badawy Amr.M., Aboul-Enein H.Y., Journal of Liquid Chromatography & Related Technologies,2010,33(3), 413 - 422 , DOI: 0.1080/10826070903526402 [3]Hisakazu Ohtani A., Hajime Kotaki A., Yasufumi Sawada B., Tatsuji Iga A. Journal of chromatography B., 1996, 683, 281-284. [4]Daniela Dal Molim Ghisleni, Martin Steppe, Elfrides E.S.Schapoval. Journal of AOAC INTERNATIONAL , 2007,90 (5), 1266-1271.Print ISSN: 1060-3271. [5]Mandava V., Basaveswara R., Reddy, B.C.K., Srinivas Rao, T. and Kalyani P. RASAYAN J. Chem. http://www.rasayanjournal.com, 2009,2(2), 361-363, ISSN: 0974-1496 , CODEN: RJCABP. [6] Raw Material in house specifications, Allergan pharmaceuticals, (HPLC procedure). [7]Raw Material in house specifications, Pharonia pharmaceuticals, (HPLC procedure). [8] J. Rose. Advanced Physico-Chemical Experiments", Pitman, London, 1964; 54. [9] N.M. Rao, J. Bagyalakshmi and T. K. Ravi, J.Chem.Pharm.Res.,2010, 2(2), 350-356. [10] R. I. El-Bagary, E. F. Elkady and A. J. Faqeh, J.Chem.Pharm.Res.,2011, 3(6), 320-329. Selectivity a Tailing factor a Resolution a Number of theoretical plates a Compound 6.26 6686 9321 T = 1 for a typical Increase with efficiency of the separation . 1-10 acceptable > 1 R > 0.8 HPLC method 99.85 0.81 0.33 6 0.66 1.03(1.83)* 1.11(5.19)* Reference method** 100.37 0.86 0.38 5 0.73 1368
Ramzia I. El-Bagaryet al ______________________________________________________________________________ J. Chem. Pharm. Res., 2012, 4(2):1361-1369 [11] U.M. Patel and R. N. Rao. J.Chem.Pharm.Res.,2011, 3(6), 200-211. [12] B.A. Moussa; R.I. El-Bagary; Y.A. Al-Eryani. J.Chem.Pharm.Res.,2011, 3(5), 425-437. [13] S.T.Hassib; A.A. El-Zaher; M.A. Fouad. J.Chem.Pharm.Res., 2011, 3(6), 243-258. [14](ICH (IQ1,IQ2 ))- ICH Q2B, Harmonized Tripartite Guideline, Validation of Analytical procedure: Methodology, IFPMA, in: Proceedings of the International Conference on Harmonization, Genevrch, March 1996. 1369