Download

1 / 26
280 likes | 316 Views
Learn about Quality Function Deployment, a planning tool to capture customer needs and translate them into technical requirements. Developed in Japan in the 1970s, QFD aids in new product development, setting strategic targets, and integrating complex information. Create a QFD matrix, determine the Voice of the Customer, rank wants, evaluate against competitors, and define operational goals to improve product quality efficiently. Capture customer information through surveys, interviews, and observations, encouraging team building and creativity. Use QFD to enhance product development and exceed customer expectations effectively.

E N D
QFD • A Quality Function Deployment diagram is a matrix used to depict customer requirements.
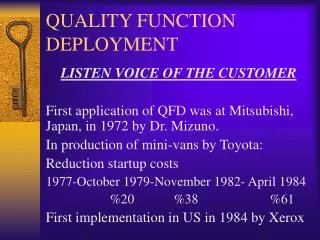
QFD • A QFD is used to capture the voice of the customer and translate it into technical information that an organization can use in order to create or improve a product. • Developed in Japan in the 1970s • Dr. Akao
QFD • It is often called a House of Quality because: • Customer information is shown horizontally • Technical information is shown vertically Customer Information Technical Information
QFD • QFD’s are planning and communication tools: • Used for new product development • Used to conform to customer demands • Used any time you have customers and you need to identify their expectations and turn that information into workable technical specifications.
QFD • QFDs are planning and communication tools: • Used to help set strategic targets • Used to help determine priority issues • Used for analysis • Used to estimate what the competition is doing • Used to integrate complex information
QFD • QFDs encourage: • Team building • Consensus • Creativity • Structure • Organization • Development of new ideas • Remove suggestiveness from the product development process
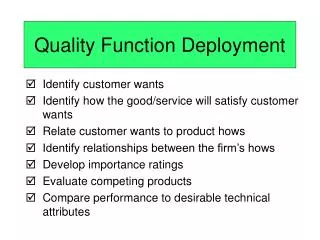
QFD • Building a QFD • Determine the Voice of the Customer • Have the customer rank the relative importance of his/her wants • Have the customer evaluate your company against competitors • Determine how the wants will be met • Determine the direction of improvement for the technical requirements • Determine the operational goals for the technical requirements • Determine the relationship between each of the customer wants and the technical requirements • Determine the correlation between the technical requirements. • Compare the technical performance with that of competitors • Determine the column weights • Add regulatory and/or internal requirements • Analyze the QFD matrix
QFD • Determine the Voice of the Customer • Capture the Voice of the Customer • Organize the Voice of the Customer
QFD • Determine the Voice of the Customer: Four types of customers • Those customers we already have and can’t lose • Those customers we could lose easily • Those customers we could gain with minor product changes • Those customers we can’t get.
QFD • Determine the Voice of the Customer: Categories of Customers • Planner: Matches product with organizational need • Funder: Pays for product, installation, maintenance, or operation • Auditor: Prevents misuse of product • Installer: Integrates product into its environment • Maintainer: Repairs the product • Operator: works with product • User 1: directly benefits from using product but may not be final user • User 2: directly benefits from using product
QFD • Determine the Voice of the Customer: Kano Model Satisfied Feeling Exciting level of Quality Physically fulfilled condition Basic level of Quality
QFD • Determine the Voice of the Customer: Capturing Customer information • Determine people to talk to • Determine the target market • Determine whether or not to survey with or without samples of the current product • Determine whether or not to use an outside organization to conduct the surveys
QFD • Determine the Voice of the Customer: Capturing Customer information • Determine people to talk to • Determine how to contact the customers • Focus groups • Interviews (telephone, one-on-one, web/email) • Questionnaires • Product clinics • Observations
QFD • Determine the Voice of the Customer • Listen • Observe • Probe • Ask for Reasons • Clarity • Understanding • Issues • Ask for Examples • Show me, help me understand
QFD • Determine the Voice of the Customer • Be sure to ask: What questions didn’t we ask that we should have? • Be sure to capture the verbatims • How did the customer say what they said?
QFD • Step 1: Determine the Voice of the Customer • What does the customer want? • Organize the Voice of the Customer • Using one ‘voice’ per post-it note, write down all information • Sort/organize the information (including verbatims) that you have gathered • Arrange the voices into groups • Place on diagram (Figure 11.3)
QFD • Step 2: Have the customer rank the relative importance of his/her wants • Rank them all (Ten is highest rank. One is lowest.) • Figure 11.4 • Step 3: Have the customer evaluate your company against competitors • Chose two competitors • Have customer rank first, second, third • The organization with the most firsts is ranked first • Figure 11.5
QFD • Step 4: Determine how the wants will be met • How will the company provide for the wants? • Translate the Voice of the Customer • Turn verbatims into technical requirements • Figure 11.6 Customer Verbatim -> Technical Requirement Cup stays cool -> Temperature at hand Won’t spill or tip: -> Tip force at top, fluid loss vertical/horizontal impact Doesn’t leak -> Porosity
QFD • Step 5: Determine the direction of improvement for the technical requirements • Figure 11.7 • A downward arrow means that improvement would happen if we reduced the technical requirements value • An upward arrow means that improvement would happen if we increased the technical requirements value • A circle means it should not be changed.
QFD • Step 6: Determine the operational goals for the technical requirements • Figure 11.8
QFD • Step 7: Determine the relationship between each of the customer wants and the technical requirements • Figure 11.9 • How does action (change) on a technical requirement affect customer satisfaction with the recorded want? • Strong positive correlation: Filled-in circle valued at 9 • Positive correlation: open circle valued at 3 • A weak correlation: triangle valued at 1 • No correlation: empty box • Negative correlation: minus sign or x
QFD • Step 8: Determine the correlation between the technical requirements. • Figure 11.10 • Strong positive correlation: Open circle • Negative correlation: minus sign or x • No correlation: empty box • Step 9: Compare the technical performance with that of competitors • Figure 11.11
QFD • Step 10: Determine the column weights • Multiply rankings by correlation values • Figure 11.12 • Step 11: Add regulatory and/or internal requirements • Figure 11.12
QFD • Step 12: Analyze the QFD matrix • What did the customer want? • How is this supported by customer rankings and competitive comparisons? • How well is the competition doing? • How does our company compare? • Where will our emphasis need to be?