Download
1 / 27
280 likes | 469 Views
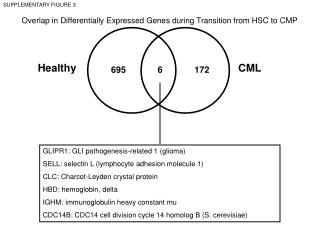
Detecting Differentially Expressed Genes. Pengyu Hong 09/13/2005. Background (Microarray). Extract RNA. Cells. Background. Extract RNA. Cells. Background. Extract RNA. Cells. Background. Extract RNA. Cells. Background. Extract RNA. Cells. 10 4 + genes. Background. Extract RNA.

E N D
Detecting Differentially Expressed Genes Pengyu Hong 09/13/2005
Background (Microarray) Extract RNA Cells
Background Extract RNA Cells
Background Extract RNA Cells
Background Extract RNA Cells
Background Extract RNA Cells 104+ genes
Background Extract RNA Cells 104+ genes
Background Extract RNA Cells 104+ genes
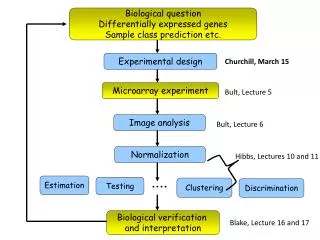
biological variability technical variability Background Biological sample • RNA extraction (total RNA or mRNA) • Amplification (in vitro transcription) • Label samples • Hybridization • Washing and staining • Microarrays are highly noisy • Use replicated experiments to make inferences about differential expression for the population from which the biological samples originate Scanning
Background Normalization Calculate Gene Expression Index
An Example 5 normal sample and 9 myeloma (MM) samples 12558 genes (rows)
Genes of Interest • Statistical significance: that the observed differential expression is unlikely to be due to chance. • Scientific significance: that the observed level of differential expression is of sufficient magnitude to be of biological relevance.
Parametric Test: t-test Statistical significance in the two group problem Group 1 (N samples): X1, X2, … XN Group 2 (M samples): Y1, Y2, … YM Assume Xi ~ Normal (μ1, σ2) Yj ~ Normal (μ2, σ2) Null hypothesis: Group 1 is the “same” to Group 2 (i.e., μ1= μ2)
Parametric Test: t-test Statistical significance in the two group problem Xi ~ Normal (μ1, σ2) Yj ~ Normal (μ2, σ2) Null hypothesis:μ1= μ2 Test null hypothesis with test statistics:
Xi ~ Normal (μ1, σ12) σ1 σ2 If variances are unequal Yj ~ Normal (μ2, σ22) (1) When N+M > 30, this is approximately normal (2) When 1 >> 2, this is approximately t(df = N–1) (3) In general, Welch approximation: t’ ~ t(df’), where
Wilcoxon rank sum test Consider row 7 of MM study 16 253 633 1008 708 36 72 28 14 33 19 49 58 23 13 4 3 1 2 8 5 10 14 9 12 7 6 11 --------------------------- rank sum = 23 This test is more appropriate than the t-tests when the underlying distribution is far from normal. (But it requires large group sizes)
P-value • p-value = P(|T|>|t|) is calculated based on the distribution of T under the null hypothesis. • p-value is a function of the test statistics and can be viewed as a random variable. • e.g. p-value = 2(1 - F(|t*|), F = cdf of t(N+M – 2). • A small p-value represents evidence against the null hypothesis differentially expressed in our case.
Permutation test • A non-parametric way of computation p-value for any test statistics. • In the MM-study, each gene has (14 choose 5) = 2002 different test values obtainable from permuting the group labels. • Under the null hypothesis that the distribution for the two groups are identical, all these test values are equally probable. What is the probability of getting a test value at least as extreme as the observed one? This is the permutation p-value.
Permutation technique Compute TS0 Compute TS1 Compute TS2 Compute TS3 The set of TSi form the empirical distribution of the test statistic TS
Scientific Significance • Fold change FC = • May not be high when statistical significance is high. • Not an appropriate measure if the dispersion is not taken into consideration.
Conservative fold change Conservative fold change (CFC) = Max (25th percentile of sample 1 / 75th percentile of sample 2, 25th percentile of sample 2 / 75th percentile of sample 1)
Sample 1: Normal (100, 1) Sample 2: Normal (103, 1) CFC = 1.0164
CFC=2.89 CFC=3.53 CFC=1.45 CFC=1.07
Gene Selection and Ranking • A high threshold of statistical significance Select genes with p-values smaller than a threshold • The selected genes are ordered according to their scientific significance (i.e. ranked by fold-changes)
The False Positive Rate (FPR) • If we select genes with p-value < 0.01, then the probability of making a positive call when the gene is in fact not differential is less than 0.01. Thus selection by p-value controls the FPR. • However, if we have 12,000 genes in a microarray, then a FPR = 0.01 still allows up to 120 false positives. To make sensible decision, we must take multiple comparisons into consideration.
Dealing with Multiple Comparison • Bonferroni inequality: To control the family-wise error rate for testing m hypotheses at level α, we need to control the FPR for each individual test at α/m • Then P(false rejection at least one hypothesis) < α or P(no false rejection) > 1- α • This is appropriate for some applications (e.g. testing a new drug versus several existing ones), but is too conservative for our task of gene selection.