Download
1 / 20
200 likes | 220 Views
In previous lectures: -- Identifying differentially expressed genes from replicates Parametric tests: -- T-test (are the means of 2 samples different?) -- ANOVA (are the means of 2 or more samples different?) Bayesian methods: baySeq

E N D
In previous lectures: -- Identifying differentially expressed genes from replicates Parametric tests: -- T-test (are the means of 2 samples different?) -- ANOVA (are the means of 2 or more samples different?) Bayesian methods: baySeq -- Bonferroni vs. q-value & other FDR corrections for multiple testing FDR (false discovery rate): cites % false positives in SET of called genes -- Defining sensitivity and specificity baySeq issues??
Now you have selected a subset of genes to focus on … But even then, there is often still an overwhelming amount of data. Need some strategies to simplify the analysis & visualization
Array 1 Array 2 Array 3 Gene X: X1 X2 X3 x coordinate z coordinate y coordinate
Array 1 Array 2 Array 3 Gene X: X1 X2 X3 x coordinate z coordinate y coordinate
Practically speaking, the Pearson correlation R is the sum of all pairwise comparisons of the gene expression values in two gene expression vectors N 1 (Xi – X)(Yi – Y) S Standard Pearson Correlation: R x,y = N SDx SDy i = 1 Array 1 Array 2 Array 3 Array 4 Array 5 Gene X: X1 X2 X3 X4 X5 Gene Y: Y1 Y2 Y3 Y4 Y5 Pearson correlation ranges from –1 (anticorrelated), 0 (uncorrelated) , 1 (identical)
Practically speaking, the Pearson correlation R is the sum of all pairwise comparisons of the gene expression values in two gene expression vectors N 1 (Xi) (Yi) S UncenteredPearson Correlation: (set the means of X and Y to 0) R x,y = N N i = 1 1 N 2 1 S 2 S Xi Yi N N i = 1 i = 1 Array 1 Array 2 Array 3 Array 4 Array 5 Gene X: X1 X2 X3 X4 X5 Gene Y: Y1 Y2 Y3 Y4 Y5 Using Standard Pearson Correlation: similar pattern + constant offset = P. corr of 1.0 Using Uncentered Pearson Correlation: similar pattern + constant offset not = 1.0
Sometimes, want to use the weighted Pearson correlation N 1 (Xi) (Yi) S P x,y = N N i = 1 1 N 2 1 S 2 S Xi Yi N N i = 1 i = 1 Array 1 Array 2 Array 3 Array 4 Array 5 Gene X: X1 X2 X3 X4 X5 Gene Y: Y1 Y2 Y3 Y4 Y5 For example: if these arrays are identical, the data are over-represented 3X You will experiment with this in lab
Excellent review by J. Quakenbush 2001 Nature Reviews-Genetics
Hierarchical clustering Goal is organize the entire dataset into one hierarchical arrangement. Know as a “bottom up” or agglomerative clustering method. Two parts: 1) Calculating gene similarity 2) Organizing genes such that similarly expressed genes are group together
Two steps of hierarchical clustering 1. Calculating the similarity matrix Calculate the Pearson correlation for every pair of genes
Two steps of hierarchical clustering 1. Calculating the similarity matrix End up with a symmetrical table of Pearson correlations
Two steps of hierarchical clustering 1. Calculating the similarity matrix Gene 2 Gene 5 Find the largest P. corr & join those genes together on a node
Two steps of hierarchical clustering 1. Calculating the similarity matrix Gene 2 Gene 5 Should Gene 10 get added onto this node?
Two steps of hierarchical clustering 1. Calculating the similarity matrix Gene 2 Gene 5 Should Gene 10 get added onto this node?
‘centroid’ (average vector) 4. Centroid linkage clustering
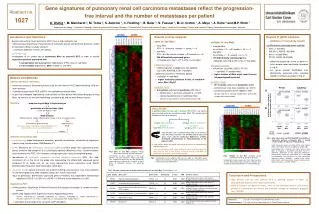
Visualization: Data are often converted to a colorimetric scale Each box: a transcript measurement Each row of boxes: transcript measurements for a given gene Each column of boxes: transcript measurements from a single array Red: higher transcript abundance in one sample Green: higher transcript abundance in the other sample
Unweighted Pearson correlation (red/green version) (blue/yellow version)