Download
1 / 20
200 likes | 444 Views
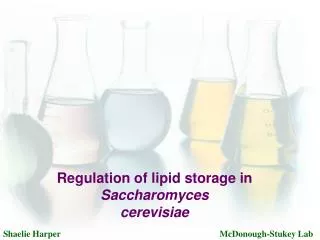
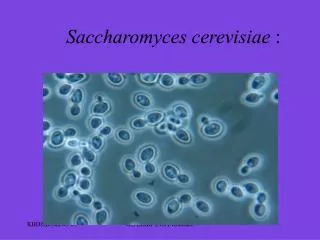
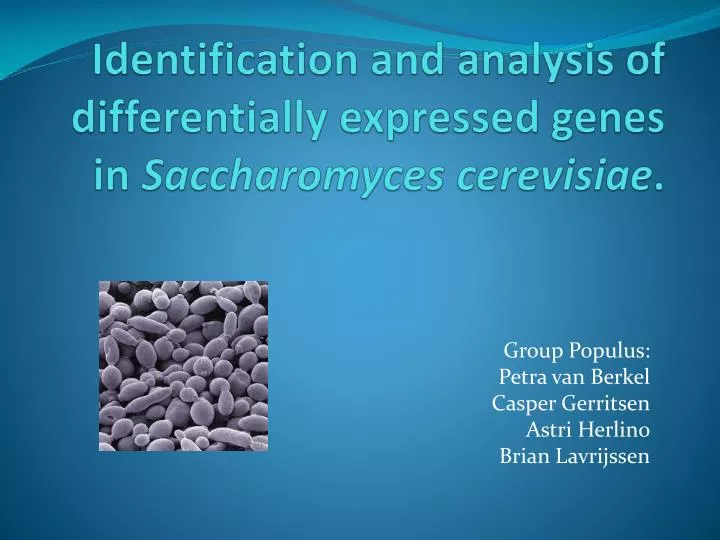
Identification and analysis of differentially expressed genes in Saccharomyces cerevisiae . Group Populus : Petra van Berkel Casper Gerritsen Astri Herlino Brian Lavrijssen. Dataset of S. cerevisiae. Data generated by Nookaew et al (2012) Two conditions:

E N D
Identification and analysis of differentially expressed genes in Saccharomyces cerevisiae. Group Populus: Petra van Berkel Casper Gerritsen AstriHerlino Brian Lavrijssen
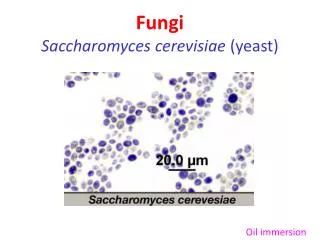
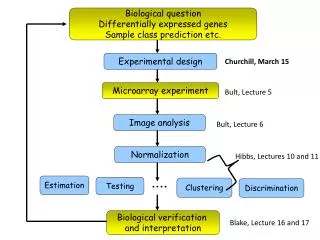
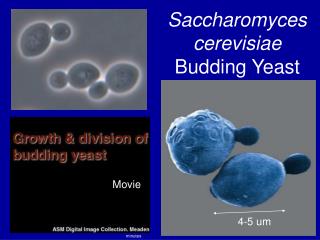
Dataset of S. cerevisiae • Data generated by Nookaewet al (2012) • Two conditions: • Glucose excess (Batch) & Glucose limited (Chemostat) • 3 Biological replicates per condition • RNA-seq data: • 12 Files • 3 Sets of Paired-end reads per condition • Pipeline for differential gene expression analysis
TopHat – Cufflinks analysis • Protocols based on Trapnellet al (2012) • 75% of reads mapped • Plots based on Cuffdiff gene expression output
Cuffdiff output 5800 genes with FPKM values Q-value threshold based on Nookaewet al (2012)
Validation of TopHat - Cufflinks • Validation of selection • Using Excel • Literature study • Boer et al (2003) • Influence of C, N, P and S limitation • Microarray analysis • > 68 out of 151 significantly upregulated • > 9 out of 33 significantly downregulated • More or less same genes found in other papers
Expression network up • Up regulated genes • mrnet method in R • Number of Nodes = 57 • Number of Edges = 1560
Expression network down • Down regulated genes • mrnet method in R • Number of Nodes = 33 • Number of Edges = 513
GO Terms and GO Enrichment R version 2.15.0 (2012-03-30) • Packages: • biomaRt: Ensembl gene 69, S. cerevisiaeEF3 • org.Sc.sgd.db • GOstats • Rgraphviz • GO enrichment: • 8419 genes in the universe (org.Sc.sgdPMID2ORF) • Threshold: p-value < 10-4
GO Terms • Down regulated 32 genes 29 genes with 208 GO terms (3 genes are not annotated) • Up regulated 133 genes 113 genes with 855 GO terms (20 genes are not annotated)
GO Enrichment • Down regulated • Biological process: not found • Up regulated
Validation: Yeast genome database • Problem: • Not well annotated because the biomaRt was not updated to Ensembl gene 70, S. cerevisiaeEF4
Top 100 • gffread: make the transcripts fasta file • Determine the top 100 highest and lowest expressed genes for the two conditions • R: order cuffdiff output on FPKM value (4 files) • Take out the genes with FPKM = 0
Top 100 • Top genes: • G3P dehydrogenase, • F16P aldolase, • Ribosomal subunit protein • Bottom genes: • dubious transcript, • retro transposon, • etc..
GC-content & transcript length • Determine GC-content and transcript length • Import top 100 genes files • For each file check the genes in top 100 file in transcripts.fa and count GC content and the transcript length
GC-content & transcript length • Highly expressed in batch: • Length: 515.19 GC: 0.43 • Lowly expressed in batch: • Length: 831.46 GC: 0.41 • Highly expressed in chemostat: • Length: 556.65 GC: 0.43 • Lowly expressed in chemostat: • Length: 727.29 GC: 0.41
GC-content & transcript length • Short sequence length! • mainly in highly expressed genes, gives unrealistic view of codon usage and intron length • These are often ribosomal subunit proteins
Intron length • Genes.gtf as input • Create an indexfile • Look for the interesting genes • Print them to an outputfile • Calculate average
Codon usage • Method (perl script): • Input are top high and low expressed genes • Build gene ID list and codons list and retrieve sequences • Count codon usage and calculate RSCU and average RSCU
Conclusion • The up and down regulated genes are involved in carbon metabolism • Highly expressed genes are involved in carbon metabolism or are ribosomal subunit proteins