Download
1 / 20
200 likes | 213 Views
Explore the significance of similar and opposite gene expression profiles in uncovering gene regulation and related functions. Learn about EpClust and J-Express software for clustering expression profiles effortlessly. Understand the differences between K-means and Hierarchical algorithms, along with various distance measurement methods. Discover how to upload and analyze data efficiently to extract biological insights. Dive into features like Phylip Format, Statistical Analysis, and motif highlighting with databases like PlantCARE. Compare Expression Profile Clusters with Promoter Motif Conservation and Gene Ontology for a comprehensive understanding of gene function.

E N D
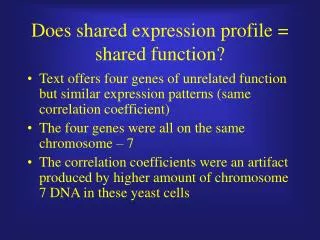
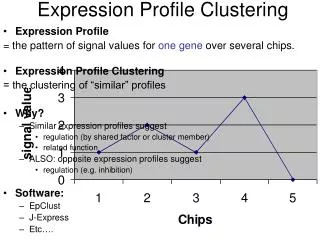
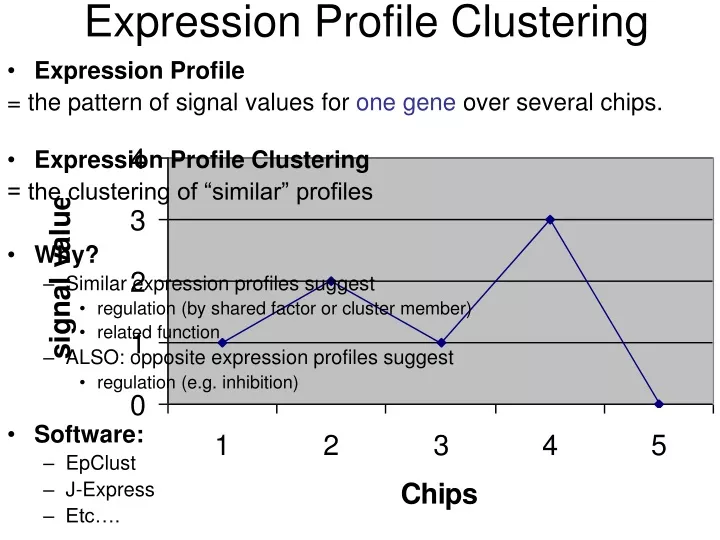
Expression Profile Clustering • Expression Profile = the pattern of signal values for one gene over several chips. • Expression Profile Clustering = the clustering of “similar” profiles • Why? • Similar expression profiles suggest • regulation (by shared factor or cluster member) • related function • ALSO: opposite expression profiles suggest • regulation (e.g. inhibition) • Software: • EpClust • J-Express • Etc….
Data file format • Can enter in a variety of formats. • See EpClust’s data upload page • One simple way: • Download tab-delimited data from NASC • Open with (or paste into) excel • Delete all but one “name” column and Signal value columns. • Do not include any hyphens! • (I try to avoid all punctuation) • Save as tab delimited text • Annotation can be added as either: • A second file with the same first column of names • A single second column in the signal file (if specified)
To Choose Algorithm Type K-means Initially choose a set number (K) of clusters 1) Chooses the K most different profiles 2) Clusters each remaining profile with one of the K So, much less time than Hierarchical (if many genes) Cluster size can vary so can return too many or few genes with no way to select. Then must repeat with different K values. Hierarchical Measures distance between each profile (i.e. gene) with each other profile So time increases exponentially with each gene Then clusters closest genes together, followed by increasingly distant ones Into a tree of clusters within clusters can be visualised and finally split at chosen distancewith knowledge of tree
So Which is “Better”? • K-Means is better able to manage large data-sets. • Hierarchical seams a more objective aproach • In that you don’t need to decide cluster number at start But which is more biologically informative? • Opinion divided. • Both artificial. • Don’t prove, just suggest. • K-means gives more consistent results. • ….and then there’s SOTAtoo!
Pearson-Based Distance Measurement The most commonly used How similar the SHAPES of the two profiles are Based on average of values and the standard deviation Rates from identical (1) to completely uncorrelated(0) to perfect opposites (-1) Centred Test? If profiles have identical shape, but offset from each other by a fixed value (or magnitude) Centred: Identical (1) Uncentred: Not (<1) AbsoluteTest? If profiles have perfect opposite expression patterns Absolute: Identical (1) Non-Absolute: perfect opposites (-1) Parametric Test? Parametric: assumes normal distribution. More rigorous where there are no outliers. Non-parametric (=spearman rank): More rigorous where there are outliers.
Euclidean-Based Distance Measurement between gene expression levels directly based on magnitude of changes More about signal VALUES. Less about profile shapes. data must be suitably normalized e.g. use log-ratios of signals Euclidean: shortest path between points Manhattan: the sum of distances along each dimension
RESULTS _MyGene
Phylip Format Format Results Picture Statistics Export Lists as Text Search for Promoter Motifs Extra Options Can get from TAIR using a list of gene names Can get from querying a database such as PlantCare using the upstream sequence of our particular gene of most interest Export clusters as: text (lists of gene names)tree cut at chosen height. Or formatted for Phylip(tree drawing software) Visualise promoter region next to each profile Highlight motifs You must tell it the sequences of motifs though. Must prepare file of upstream sequences Currently must arrange with EpClust staff to upload
PlantCARE Cis-Acting Regulatory Elements http://intra.psb.ugent.be:8080/PlantCARE/ • Database of CAREs • Tools • Search for CARE • Enter upstream sequence of a gene • Lists and then highlights known motifs from database • Motif Sampler • Enter upstream sequences of your cluster • Highlights 8mers conserved more in cluster members than in genome • Other tools • Clustering • Query for info on motifs
Gene Ontology A hierarchical structure to describe gene function. As PlantCARE compares: Expression Profile Clusters to Promoter Motif Conservation There are also tools to compare: Expression Profile Clusters to Gene Ontology