Download

1 / 18
180 likes | 196 Views
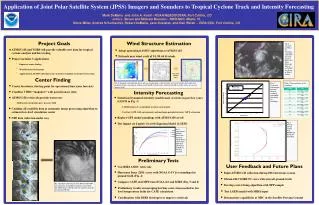
Explore deterministic and probabilistic approaches for tropical cyclone wind predictions during the Joint Hurricane Testbed Project. Review methods such as GRIP model, neural network techniques, Monte Carlo wind probability model, and SHIPS forecast skill. Analyze the impact of input data sources on prediction accuracy. Evaluate the performance of various models based on historical data and real-time testing.

E N D
Improvements in Deterministic and Probabilistic Tropical Cyclone Wind Predictions: A Joint Hurricane Testbed Project Update Mark DeMaria and Ray Zehr NOAA/NESDIS/ORA, Fort Collins, COJohn Knaff and Kimberly Mueller CIRA/CSU, Fort Collins, CO Presented at The Interdepartmental Hurricane Conference March 2005 Jacksonville, FL
Outline • Deterministic Intensity Prediction • GOES and Recon Intensity Prediction (GRIP) model • Predictors from aircraft recon and IR radial structure combined with SHIPS forecasts • Evaluate neural network techniques • Probabilistic Intensity Prediction • Monte Carlo wind probability model • Results from 2004 • 2005 Plans • Are Intensity Forecasts Improving?
The 2004 SHIPS Model • Statistical-dynamical intensity model (12-120 hr) • Developed from 1982-2003 sample • Empirical decay for portion of track over land • Track from adjusted 6-hour old NHC forecast • Version with satellite input operational for 2004 • SHIPS Input • Climatological: Julian Day • Atmospheric Environment: Shear, T200, 200, 850 • Oceanic Environment: SST, Ocean Heat Content • Storm Properties: Vm, dVm/dt, motion, PSL, lat, GOES Cold Pixel Count, GOES TB Std Dev • Most storm property inputs are indirect measurements
Aircraft Data in the GRIP Model • USAF Reserve and NOAA aircraft data • Highly utilized for intensity estimation • Under utilized for intensity prediction • Real time automated analysis system • Real time aircraft database set up on NCEP IBM (C. Sisko) • Move data to storm-relative coordinates • Automated quality control • Test for data coverage • Gross error check • Check deviations from pre-analysis • Variational objective analysis in cylindrical coordinates • Greater azimuthal than radial smoothing
Sample Analysis for Hurricane Jeanne 2004 Input Data Wind Analysis Isotachs 358 Dependent Cases (1995-2003, 12 hour intervals) 124 Independent Cases (2004, 6 hour intervals) Input to GRIP Model: Azimuthally Averaged Tangential Wind
GOES Data in the GRIP Model • SHIPS already includes cold pixel count and Tb standard deviation (area averages) • Examine radial structure of GOES data for predictive signal Azimuthal Average
GRIP Model Statistical Development • GRIP Predictors • EOF Version • SHIPS Forecast • Amplitudes of first four EOFs of GOES and Recon profiles (principal components) • Physical Version • SHIPS Forecast • 10 physical parameters from GOES and recon profiles • Final GRIP Model • EOF Version • SHIPS forecast, 2 recon PCs, 1 GOES PC • Physical Version • SHIPS forecast, 3 recon variables, 1 GOES variable • Both versions tested on 124 cases from 2004 Atlantic season
2005 GRIP Model • Add 2004 cases and re-derive the coefficients • ~20% increase in sample size • Consider combined EOF and physical variable version • Run in real time during 2005 season for further evaluation
Neural Network Model(Short Version: It didn’t work) • NN Model Development • SHIPS dependent dataset used for training • Non-satellite version • Development by Prof. Chuck Anderson, CSU computer science department • 5 to10% reduction in mean absolute error in dependent sample (12-120 hr) • Independent tests • 2-5% degradation • NN Method appears to over-fit training data • One final try with more stringent fitting requirements • Restrict input to only those predictors selected by SHIPS
Monte Carlo Wind Probability Model • Provides 5 day surface wind probabilities • 34, 50 and 64 kt • Historical NHC track, intensity and radii-CLIPER error distributions • Includes forecast interval time continuity and bias corrections • Run in real time on NCEP IBM during 2004 • Results displayed on password-protected CIRA web site • Atlantic, east, central and western N. Pacific sectors
2005 Monte Carlo Model • Move web page to TPC w\ N-AWIPS graphics • Add t=0 hour probabilities • Include radii adjustment • Convert max in quadrant to average in quadrant • Ratios based upon H*Wind analyses • Provide TPC with distribution calculation code • Text product under development • Training being developed • Verification system still needed • Verification system could be used for all TC probabilistic forecasts (ensemble based, etc)
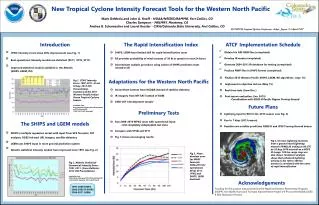
Are Intensity Forecasts Improving? • 20 Year Atlantic sample (1985-2004) • Verification with consistent set of rules • All cases except extra tropical • Official, Persistence, SHIFOR, SHIPS and GFDL • Consider only 48 hour forecasts
48 Hour Intensity Forecast ErrorsNormalized by Persistence Errors
Summary • GRIP Model to be tested in real time during 2005 season • 2004 results are encouraging • Last chance for neural network model • Monte Carlo probability model development continuing in 2005 • Intensity forecasts are improving Ref: Further improvements to SHIPS, Weather and Forecasting, in press.