Download
1 / 16
160 likes | 176 Views
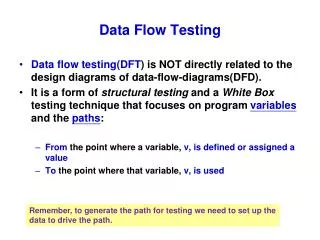
Learn when to stop testing through structural analysis, considering factors like time, failures, defects, and test case coverage. Explore the Triangle Problem example to understand decision-decision path coverage. Discover the importance of boundary value testing and equivalence classes.

E N D
Summarizing “Structural” Testing • Now that we have learned to create test cases through both: • a) Functional (blackbox)and • b) Structural(whitebox) testing methodologies we might ask how much is “enough” or “when should we stop testing.”
Some potential answers to “when is enough” Testing • We stop testing:
Some potential answers to “when is enough” Testing • We stop testing: • When we run out of time • When no more failure is encountered during testing • When no more defects are revealed by testing • When we have executed all the designed test cases • When we can not think of any more test case to run • When we reach a point of “diminishing” return • When all faults are discovered similar Un-decidable or When the preset % of “fault seeds” are found – see last slide
Explanation of “when to stop” testing • Unfortunately, “when we run out of time” is an often used criteria to stop testing! (Think of the following): • Customer satisfaction • Increased customer support cost and fix cost • Some quality conscious organization uses reliability theory and the concept of “when no more or “little” failures or defects can berevealed” is when we stop testing. (hard to do.) • “When we have executed all the designed test cases” is fine if the designed test cases provide good coverage; otherwise, it is just a convenient statement to meet schedule. • “When we can not think of anymore test case” after properly analyzing the test case coverage would be another acceptable solution. • “When we reach a point of diminishing return” is a good management solution similar to the reliability theory of not revealing anymore new defects or failures. (otherwise – “diminishing return needs to be defined) • “When all faults are discovered” is not possible theoretically and especially so for large systems.
Diminishing Return # of Total Bugs Found terminate testing Start considering terminating testing Time or Total Test Cases Run
Test Case Coverage • For us, test case coverageis a key issue in determining when to stop testing. We stop testing when our tests have covered all that wewant to cover. Ask: • Are there gaps and redundancies? • Have we covered all the relevant situations? We will use the Triangle Problem as an example to look at these questions
Previous Sample Triangle Psuedo-code 1. Program Triangle 2. Declare a, b, c as Integer 3. Declare IsTriangle as Boolean 4. Output ( “enter a, b, and c integers”) 5. Input (a, b, c) 6. Output (“side 1 is”, a) 7. Output (“side 2 is”, b) 8. Output (”side 3 is”, c) 9. If (a<b+c) AND (b<a+c) And (c<b+a) 10. then IsTriangle = True 11. else IsTriangle = False 12. endif 13. If IsTriangle 14. then if (a=b) AND (b=c) 15. then Output (“equilateral”) 16. else if (a NE b) AND (a NE b) AND (b NE c) 17. then Output ( “Scalene”) 18. else Output (“Isosceles”) 19. endif 20. endif 21. else Output (“not a triangle”) 22. endif 23. end Triangle2
Condensation Graph from pseudo code Statements coverage - 4 paths Branch (DD-path) coverage - 4 paths Cyclomatic # = 4+1 = 5 - 5 lin. Ind paths All combinations - 8 paths first 1- 8 9 10 11 Is_Triangle= True Is_Triangle = False 12 Triangle ~Triangle 13 14 21 16 15 Not triangle equilateral 17 18 scalene isosceles 19 20 22 Last
All Combination paths ? • Let’s look at the all 8 combination paths • P1: < 8,9,10,12,13,14,15,20,22> (Equilateral) • P2: <8,9,10,12,13,14,16,17,19,20,22> (Scalene) • P3: <8,9,10,12,13,14,16,18,19,20,22> (Isosceles) • P4: <8,9,10,12,13,21,22> (not possible) • P5: <8,9,11,12,13,14,15,20,22> (not possible) • P6: <8,9,11,12,13,14,16,17,19,20,22> (not possible) • P7: < 8,9,11,12,13,14,16,18,19,20,22> (not possible) • P8: <8,9,11,12,13,21,22> (Not a triangle) - So, there are 4 decision-decision (dd) paths (branch testing) that make sense. - These are P1, P2, P3, and P8. - We should at least test these four paths.
Compare against Boundary Value Test(15 test cases for Triangle problem ) Remember the boundary: 1 ≤ TriangleSide ≤ 200 Test case a b c expected output paths 1 100 100 1 Isosceles P3 2 100 100 2 Isosceles P3 3 100 100 100 Equilateral P1 4 100 100 199 Isosceles P3 5 100 100 200 Not Triangle P8 6 100 1 100 Isosceles P3 7 100 2 100 Isosceles P3 8 100 100 100 Equilateral P1 9 100 199 100 Isosceles P3 10 100 200 100 Not Triangle P8 11 1 100 100 Isosceles P3 12 2 100 100 Isosceles P3 13 100 100 100 Equilateral P1 14 199 100 100 Isosceles P3 15 200 100 100 Not Triangle P8 Let’s analyze this table in more detail --- next chart
Comparison Summary • Potential “Gap” exist in the Boundary ValueTest. When we look at the equivalence classes (or logic table) of the outputs, we see that Scalene triangle is not covered. • Path P2 is not covered with the 15 Boundary Value test cases! • There are, however, lots of “Duplications” • P3 is covered 9 times (Isosceles triangle) • P1 is covered 3 times (Equilateral) • P8 is covered 3 times (Not Triangle) Clearly, boundary value (functional testing) is not enough here ; is it possible that it is alsonot as efficient?
Comparison Metrics of Functional .vs.Structural Test Effectiveness • Assume • Functional Test M generates m test cases • Structural Test S generates s structural elements. (structural elements = the chosen paths for the S test) • When all of the m test cases are executed, then n , where n ≤ s, of the s structural elements are traversed or covered. • Then consider 3 metric of evaluating testing “effectiveness” of functionalwith respect to structural are: • Coverageof M with respect to S: C(M,S) = n/s • Redundancyof M with respect to S: R(M,S) = m/s • Net redundancy of M with respect to S: NR(M,S) = m/n
Comparison for the Triangle Example • The Boundary Value Test, M, generated 15 test cases; so m = 15. • The dd –path (or Branch) Test generated 4 paths for test cases; so s = 4. • The 15 M test cases covers 3 of the 4 paths from the S test; so n = 3. The 3 comparison of effectiveness of M to Sshows: Coverage(M,S) = 3 / 4 : 75% coverage effectiveness Redundancy(M,S) = 15 / 4 : 375% redundancy NetRed(M,S) = 15 / 3 : 500% net redundancy Note the penalty here
Relative Efforts(Test complexity) Comparison within Structural Test Methodologies Effort to identify test coverage elements Sophistication in methodology dd path Basis d-u path slice (branch)
Should we consider Structural Test Complexitywhen Designing? • If so ----- • Since program slice testing takes more effort, should we have less program slices in our programs? • If we do have program slices, should those slice size (# of statements) be small?
What was that “fault seeding” stop criteria? • Fault seeding is a technique for • i)determining when to stopand/or for • ii) projecting “escaped” bugs. • Fault seeding technique: • Develop a number of bugs (e.g. 20 bugs) and seed them into the product, without letting the testers know. • Pick a % (e.g. 90%) of discovery of the seeded faults by the test team to be considered as the stopping criteria. • Run the tests and see if .9 x 20= 18 of the seeded bugs are found. Stop testing only if 90% is reached. • If the total number of unique problems found is Z (e.g. 45, NOT including the 18 seeded fault), then we may roughly project the remaining non-seeded problems are: - 45/Y = 18/20 - y = 50 - remaining non-seeded problems = 50-45 = 5 - project that there are 5 more undetected problems remaining