Download
1 / 78
780 likes | 952 Views
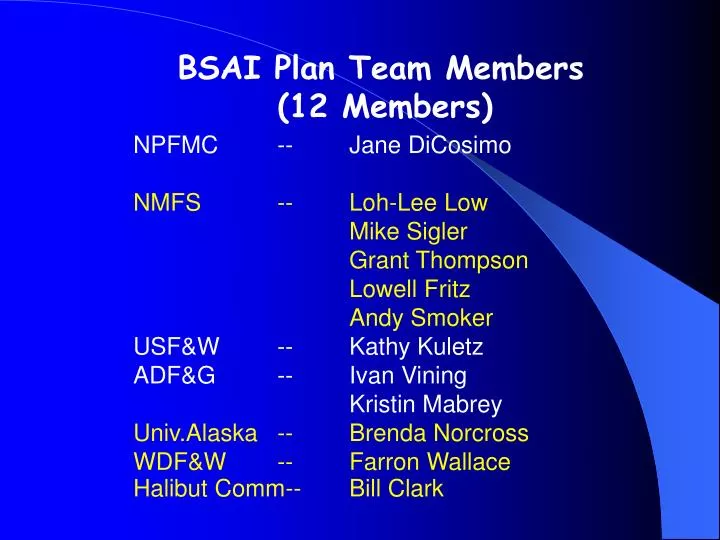
BSAI Plan Team Members (12 Members). NPFMC -- Jane DiCosimo NMFS -- Loh-Lee Low Mike Sigler Grant Thompson Lowell Fritz Andy Smoker USF&W -- Kathy Kuletz ADF&G -- Ivan Vining Kristin Mabrey Univ.Alaska -- Brenda Norcross WDF&W -- Farron Wallace

E N D
BSAI Plan Team Members (12 Members) NPFMC -- Jane DiCosimo NMFS -- Loh-Lee Low Mike Sigler Grant Thompson Lowell Fritz Andy Smoker USF&W -- Kathy Kuletz ADF&G -- Ivan Vining Kristin Mabrey Univ.Alaska -- Brenda Norcross WDF&W -- Farron Wallace Halibut Comm-- Bill Clark
Ex-Vessel Value of Alaska Landings2.5 million mt (1998-2001 Average)Average Annual Ex-Vessel value = $822 Million
Bering Sea-Aleutians Groundfish Catch25 Year History (in thousands of mt)
Exploitable Biomass By Major Species Groups
Estimated ABCs By Major Species Groups
BSAI Groundfish Complex ABCs Yr 2003 Total = 3.33 MMT(Up 147,000 mt from 2002)
Assessment Theme ABC = Biomass x Exploitation Rate 1. Determine Biomass from -- Surveys….Hydroacoustics, Trawls -- Models…..Age or Length-Structure Models 2. Determine Exploitation Rates -- Fmsy -- F overfishing ……. Example F35% -- Fabc …………… Example F40%
Assessment Theme Fishing Rates chosen according to 6 Tiers of Data Quality (Pages 5-6 of SAFE Summary) Tier 1 -- reliable B, Bmsy, pdf of Fmsy Tier 2 -- reliable B, Bmsy, Fmsy, F35, F40 Tier 3 – reliable B, B40, F35, F40 Tier 4 – reliable B, F35, F40 Tier 5 -- reliable B and M Tier 6 –- reliable Catch History Data
EBS Pollock AssessmentNotable Features 1. Year 2002 Surveys Bottom Trawl Biomass = 4.82 mmt, up 16% EIT Survey Biomass = 3.6 mmt, up 18% 2. Year 2002 Models 7 scenarios of Age-Structure Models, Used Model 1 Age3+ Biomass for 2003 = 11.8 mmt, up 6% 3. Recruitment 1998 & 1999 Year Classes both Above Average
Aleutian Island Region Pollock Assessment 1. Model don’t work, Not unit stock 2. Survey Biomass • Year Biomass • 1991 167,140 • 1994 77,503 • 1997 93,512 • 2000 105,554 • 2002 175,000 3. ABC = 0.75 * B2002 • (Tier 5)
Bogoslof Region Pollock ABC 1. Plan Team Method – Tier 5 ABC = Biomass x 0.75 M ABC = 34,000 mt 2. SSC Method – Use 2 mmt as Target Biomass ABC = 4,070 mt
Pacific Cod AssessmentNotable Features 1. Year 2002 Surveys -- EBS Trawl Biomass = 617,000 t, down26% 2. Year 2002 Model -- Update of Last Year’s Model -- Estimated 2003 Age 3+ Biomass = 1.68 mmt, up 9% 3. Recruitment -- Year classes since 1992 have been below average -- Except for above average 1996 & 1999 year classes
Yellowfin Sole AssessmentNotable Features 1. Survey Biomass -- Relatively high biomass, doubled from 1975-79 -- Declining in recent years as strong year classes passes out of the population 2. Models -- Estimated 2003 Age 3+ Biomass = 1.55 mmt, down 1% -- biomass is still high but definitely declining 3. Recruitment -- Lowered recruitment in last decade
Greenland Turbot AssessmentNotable Features 1. Survey Biomass -- EBS Trawl Biomass assess juveniles only 2. Modeling -- Yr 2003 Age 1+ biomass = 115,700 mt, down 5 -- biomass is generally low and relatively stable 3. Recruitment -- Generally Low recruitment in last 2 decades
POP AssessmentNotable Features 1. Present Assessment -- Single Model to Combined Bering Sea/Aleutians Areas 2. Biomass Trend -- Rather Stable Trend in recent years after some rebuilding Recruitment -- Rather Poor Recruitment in recent years
Other Red Rockfish Notable Features 1. Other Red Rockfish Split into: -- Northern -- Rougheye/Shortraker 2. Tier 5 ABC = Average 1991-2002 Survey Biomass x 0.75M Stock EBS Aleutians Northern 18 mt 6,6980 mt (99.7%) Rougheye-Shortraker 137mt 830 mt (85.8%)
Other Rockfish AssessmentsNotable Features 1. Presently Managed as a Complex 2. Author Recommend separating out Dusky Rockfish -- Catch rate maybe as high as 34% 3. Plan Team disagree, maybe catch rate estimated high -- Noted survey biomass has not decreased 4. Tier 5 ABC = Survey Biomass x 0.75 M Stock Year Survey Biomass ABC EBS 2002 18,000 960 AI 2002 15,000 634
Atka Mackerel AssessmentNotable Features 1. New Assessemnt Model – AD Model Builder 2. Authors ABC Considerations -- Survey Biomass 2002 = 773,000 mt up 51% from 2000 survey; Shows high variability -- Yr 2003 Model biomass = 358,000 mt, down 7 % from Yr 2002; -- Max Permissible F40 would yield ABC = 82,800 mt -- 1998 Year Class showing strength 3. Plan team favors using average F over last 5 years -- ABC = 51,000 mt -- slight increase over 2002 ABC of 49,000 mt 4. ABC apportioned by area using weighted last 4 survey biomass
Sablefish AssessmentNotable Features 1. Longline Survey Abundance -- Increased 5% in numbers and 7% in weight 2. Modeling -- Abundance now appears moderate and increased from recent lows 3. ABC according to Tier 3b -- Max Permissible F 40 adjusted gives ABC = 25,400 mt -- Team and Author recommend ABC = 18,400 mt Simulation shows spawning biomass will have low probability of dropping below historic low biomass 4. ABC is apportioned by 5-year exponential weighting of abundance indices by region: EBS, AI & GOA
Squid AssessmentNotable Features 1. Squid ABC is calculated under Tier 6 …. average catch from 1977-1995 2. Begin managing by Major Taxonomic Groups a. For Sculpins & Skate …. ABC = Tier 5 Situation = 0.75M * Biomass b. For Sharks and Octopus ….. ABC = Tier 6 = Average 1977-1995
4 Cases when Max Permissible ABC was Adjusted Down by Plan Team