Download
1 / 21
210 likes | 354 Views
Early Offshore Petroleum Development Cost Estimates Using GIS. Narmina Lovely, GEOG 596A Advisor: Patrick Kennelly. Outline. Introduction – the Business Challenge Summary of Discovery to Development Process Spatial Characterization of Prospects and GIS Methodology

E N D
Early Offshore Petroleum Development Cost Estimates Using GIS Narmina Lovely, GEOG 596A Advisor: Patrick Kennelly
Outline • Introduction – the Business Challenge • Summary of Discovery to Development Process • Spatial Characterization of Prospects and GIS Methodology • Engineering Characterization of Prospects • Integration of GIS with Other Applications • Presentation of Results • Conclusion and Future Steps
The business challenge • Estimate petroleum development costs to guide exploration program • Automate, standardize and codify engineering cost estimation
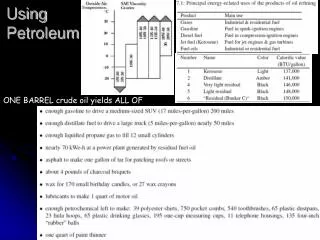
The business challenge While X has bigger volume, Y might be a better value 50$ a barrel 15$ a barrel TD: 20000 WD: - 4964 VOL: 250 AGE: Miocene Pressure: 24480psi HC Type: Oil TD: 25000 WD: - 5365 VOL: 310 AGE: Miocene Pressure: 28378psi HC Type: Oil
Appraisal well Exploration well Exploration well Appraisal well Discovery to Development Process Exploration • Exploration prospect inputs • Outline of prospect area • Well location • Reserve Size • Water Depth • Target Depth • Fluid Type • Expected Pressures • Output is well cost and well timing Appraisal • Number of appraisal wells determined by reserve size • Output is well cost(s), seismic cost, and timing Field Development • Based on logic from tool which will be seen in upcoming slides • Output is all development costs and production forecast for life of field
3000 feet 30o Spatial characterization of developments • Well Spacing Calculation • Bottom Holes Placement • Maximum Drill Reach Calculation • Drill Center Distribution • Gathering System Alignment for Multi- drill Center Scenarios • Generation of Tie-Back Options
Spatial characteristics of developmentsWell Spacing Calculation INPUTS: Hydrocarbon type Prospect Area and Shape Maximum Volume per Well
Spatial characteristics of developmentsBottom Holes Placement
3000 feet 30o Spatial characteristics of developmentsMaximum Drill Reach Calculation INPUTS: Target Depth Water Depth Maximum drill reach Spatial Well Distribution
Spatial characteristics of developmentsDrill Center Distribution
Spatial characteristics of developmentsGathering System Alignment for Multi-drill Center Scenarios INPUTS: Center of the Prospect Drill centers Spatial Distribution
Spatial characteristics of developmentsGeneration of Tie-Back Options • INPUTS: • Hydrocarbon Type • Platforms Spatial • Distribution
Engineering characterization of prospects Engineering characterization of developments • a. Drilling performance and well types • b. Completion technologies and configurations • c. Production facilities and tie-backs • d. Additional production parameters
3000 feet 30o Engineering characterization of prospectsDrilling Performance and Completion Technologies • Drilling performance (days to drill 10,000ft) • Varies by geologic target • Well tangibles vary by geologic target • Drill rig day rates ($/day) – company rates • Rig type • MODU or Platform Rig • Type of Well • Exploration, appraisal, or development • Completion type • Wet tree or dry tree • Maximum drill reach • Establishes number drill centers required
Typical Wet Tree Development Engineering characterization of prospects Production Facilities and Tie-backs • Wet Tree Local FPS host cost a function of: • Peak field production • Water injection requirements • Number of wells • Shut in Tubing Pressure • Water depth • Subsea tie-back to existing FPS host • Oil – 25 mile radius • Gas – 75 mile radius • Subsea cost a function of: • Number of wells • Number of drill centers • Distances between drill centers • Shut in Tubing Pressure • Dry Tree local FPS host cost a function of: • Peak field production • Water injection requirements • Drill rig requirements (Dry tree development only) • Number and type of wells • Shut in Tubing Pressure • Water depth
Engineering characterization of prospects Additional Production Parameters • Field production forecast is the sum of individual wells brought online per drilling and completion schedule. Well forecasts utilize initial rate, reserves per well, and decline by geologic age. • Water injection wells are the ratio of producing wells with well depth consideration. • Optimize facility options (dry tree versus Subsea tie-back) based on number of wells at each drill center • Export pipeline cost included to existing FPS’s within 30 miles or nearest one • Matches facility cost spending profile with first oil date • Facility abandonment and salvage cost included
Presentation of results Organization of results Engineering characterization of developments Spatial characterization of developments ArcGIS & ET GeoWizards MS Excel MS Access PowerPoint VBA Automation GIS and Information Technology applied Flow of Automation
A Organization of results
BP CONFIDENTIAL Indicators(NRI) Success Risked Ps: 25% IRR % NPV7 ($m) % Disc. payback (yrs) IE (NPV/WI capital) Capital ($m): Gross WI:9% E&A Drilling: 607 57 Dev drilling: 11,788 1,107 Facilities: 3,853 362 Cap OH: Total: 16,248 1,525 Subsurface Data: Gross recoverable mmboe 250 Net recoverable mmboe 63 Reserves per well mmboe/well 9 Number of producers 27 Number of injectors 9 ProspectXSS Development w Semi Host
Conclusions • Manual process was automated for a batch of prospects • Took days for each prospect manually, a matter of minutes automatically with favorable results • ARCGIS was a key technology to automate the calculation • Integration of GIS Technology with Access, Excel and PowerPoint • Generated results for hundreds of prospects for comparison purposes: 800+ prospects, 2,300+ development options • Future Steps: • Incorporate an economic model for the output • Simplify cost estimate updating • Incorporate portfolio analysis toolkit
Acknowledgements • BP Engineering Team - Engineering Characterization of developments • Charles Fried - Flow of Automation between GIS and Excel Engine • Patrick Kennelly – Penn State Program Advisor