Download
1 / 34
370 likes | 547 Views
This presentation will probably involve audience discussion, which will create action items. Use PowerPoint to keep track of these action items during your presentation In Slide Show, click on the right mouse button Select “Meeting Minder” Select the “Action Items” tab

E N D
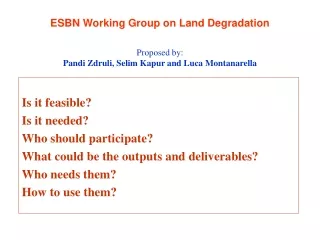
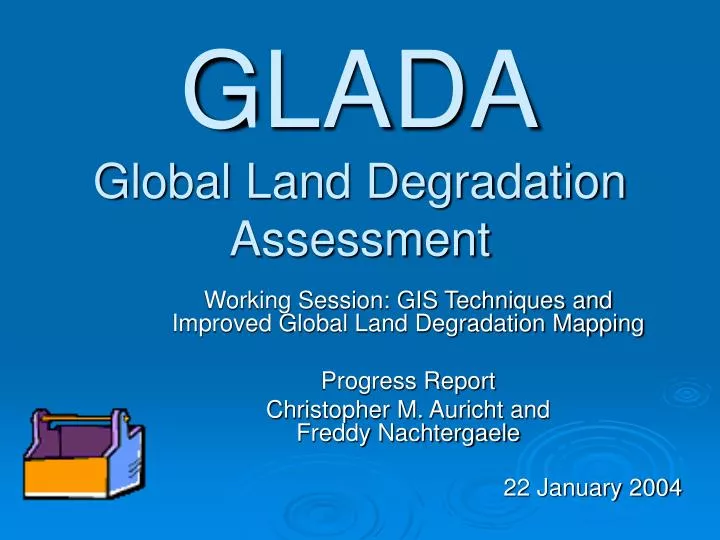
This presentation will probably involve audience discussion, which will create action items. Use PowerPoint to keep track of these action items during your presentation • In Slide Show, click on the right mouse button • Select “Meeting Minder” • Select the “Action Items” tab • Type in action items as they come up • Click OK to dismiss this box • This will automatically create an Action Item slide at the end of your presentation with your points entered. GLADAGlobal Land Degradation Assessment Working Session: GIS Techniques and Improved Global Land Degradation Mapping Progress Report Christopher M. Auricht and Freddy Nachtergaele 22 January 2004
Agenda • Introduction Background • Progress - • Updating GLASOD Dataset • ASSOD & SOVEUR • Additional improvements • Protected Area, cold areas etc • Techniques for Identification of Hotspots • P/PET • LGP • Other Issues – Clarification and Next Steps • Data & Info Products • Presentation/Visualization • Data Dissemination • Additional processing and analysis – options/requirements
Introduction / Background • Need to appreciate that exercise will remain very much a ‘product in progress’ I.e. On-going activity • Requires a methodology that can accommodate integration of new improved data layers as they become available • Work plan developed around a step-wised approach with outputs from each stage saved as a discrete dataset -> possible to re-run whole process. (Note: Could also develop a spatial model that automates process)
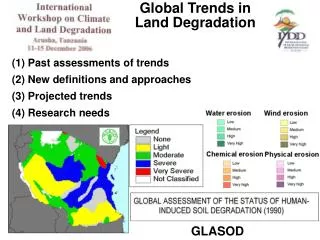
ProgressPart 1: ASSOD/SOVEUR • Basic GLASOD Update • Input Datasets • 1:10 million 1990, GLASOD Dataset • ASSOD, 1:5 Million 1995 (South East Asia) • SOVEUR, 1:2.5 Million 2000 (Central & Eastern Europe) • Processing / Merging • Reprojection, recoding and merging of new data • Output • Updated GLASOD dataset
GLASOD Update – Major Cause • ASSOD • Original GLASOD
GLASOD Update – Degree • ASSOD • Original GLASOD
GLASOD Update – Extent • ASSOD • Original GLASOD
GLASOD Update – Severity/Impact • ASSOD • Original GLASOD
GLASOD Update – Major Cause • SOVEUR • Original GLASOD
GLASOD Update – Degree • SOVEUR • Original GLASOD
GLASOD Update – Extent • SOVEUR • Original GLASOD
GLASOD Update – Degree • SOVEUR • Original GLASOD
GLASOD Update – Major Type • SOVEUR • Original GLASOD
Summary – ASSOD/SOVEUR • Issues during processing - • Coding not standardised – took time to sort some things out! Would be a lot easier if some standards were introduced and used! • Some polygons without any attributes! • Separating ‘compound’ attributes (eg. Cause/Second Cause Type, severity etc were all in one field in SOVEUR) took additional time -> much easier if each attribute has a separate field • New Dataset produced • Separate Grids (Datasets) for ASSOD & SOVEUR maintained
Part 2: Updating of New Master GLASOD Dataset -> Improving Rigour • No of datasets available to improve the rigour – accuracy of GLASOD Dataset • Run a series of iterations on dataset based on specific thematic material and assumptions • Datasets available include • WCMC protected areas • IFPRI’s Agriculture areas dataset • Kassel/FAO Irrigation Dataset • Population • Slope • Livestock • Urban areas etc
Part 2: Updating of New Master GLASOD Dataset -> Improving Rigour Cont. • Assumptions • Consider as non-degraded all areas identified as Protected in WCMS dataset regardless of what GLASOD info • Where agriculture is given as cause in GLASOD create new info only retaining that part which is indicated as agriculture in IFPRI’s map or if is irrigated according to Kassel • Where deforestation/loss of vegetation is given as cause only retain where forestry is significant (>25%) • Where overgrazing is problem only retain if livestock density exceeds a certain density • Chemical Pollution – restrict where cause is indicated as ‘salinization’ to areas where there is irrigation • Consider all areas <2% slope free of water erosion • Consider all areas of tropical rain forest as non-degraded except where deforestation is indicated in GLASOD • Consider all areas of population density <2p/km2 as non degraded • Consider all areas with cold or polar climate as non-degraded
ProgressPart 2: Results to date • Change Area to NDA if WCMC Protected.
Part 2: Results to date. Cont. • Change Area to NDA if Polar Climate
Comments • Problems with aggregating 30 arc second datasets to 5 min for Population. Used GAEZ Population Plate 62 – Class One person or less / km2. Surprisingly large area! • Similar problem for WCMC protected areas but overcome by filtering so only cells > 50% protected area retained. • Polar Climate – had minimal impact as low pop areas anyway
Comments. Cont. • Tropical Forest & No Forest. Problem summarizing 1 km dataset to 5 min. Used ‘Major Ecosystems’ Plate 55 from GAEZ. Combined Forest Class with Climatic Zones to get ‘Tropical Forest’. Combined Cause Gri, class ‘Deforestation’( Cause-f). -> problem in assiging non-degraded area status to all tropical forest areas no listed as having deforestation as a primary cause of degradation.
Comments. Cont. • Sealing – Used ‘Major Ecosystems’ Plate 55 from GAEZ: Class 11: Urban Agglomerates – seemed to work well for Europe and North America, but didn’t pick up some areas in Asia • Water Erosion in Flat Area – Combined Water Erosion (Major_Type, Grid class ‘w’) with slope grid. Worked well.
Part 2: Results to date. Cont. • Collective results to date
Issues • Datasets kept discrete process can be repeated if/when better info available e.g. population – urban / rural at 5 min • Livestock model not yet available / implemented
Part 3: Techniques for Identification of Hotspots • 30 Year Datasets for LGP and P/PET obtained from IIASA • Possible to determine hotspot areas • Recently commenced this work
ProgressPart 3: Techniques for Identification of Hotspots • Converted all datasets to ESRI Grid format • Explored methods for analysing and visualizing time series data • *.avi movie • Flash movie Click Here to demo *.avi movie Enter Alt+F4 to close the link window Click Here to demo *.flash movie Enter Alt+F4 to close the link window
Summary of Outputs to date • Updated GLASOD with ASSOD & SOVEUR • Individual GRID datasets for various thematic layers • 30 Year LGP and P/PET Grids • Demo of movie visualization options
Attention Areas • Other Issues – Clarification and Next Steps • Data & Info Products • Presentation/Visualization –> CD with dynamic viewing tool (Terrastat,Dynamic Atlas, Arc Reader) or pdf etc? • Movies –> Global, regional ? Screen resolution? • Data Dissemination –> Terrastat Integration and/or separate CD?
Attention Areas. Cont • Additional processing and analysis for 30 year datasets: options/requirements -> combine grids • Identify hotspots by determining max, min, mean for each cell. • Analyse based on mean class for P/PET and LGP. • Compare results or summarize by FS, AEZ etc?
Attention Areas. Cont • Other Datasets – • Use of Remote Sensing products – MODIS, SPOT NDVI, Global Landsat (GeoCover), Africover etc? • Others ?