Download
1 / 29
290 likes | 536 Views
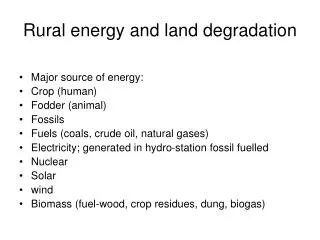
Global Trends in Land Degradation. Past assessments of trends New definitions and approaches Projected trends Research needs. GLASOD. Soil degradation severity. Soil degradation severity and vegetation. Low. Soil degradation. High. Low. High. Vegetation index.

E N D
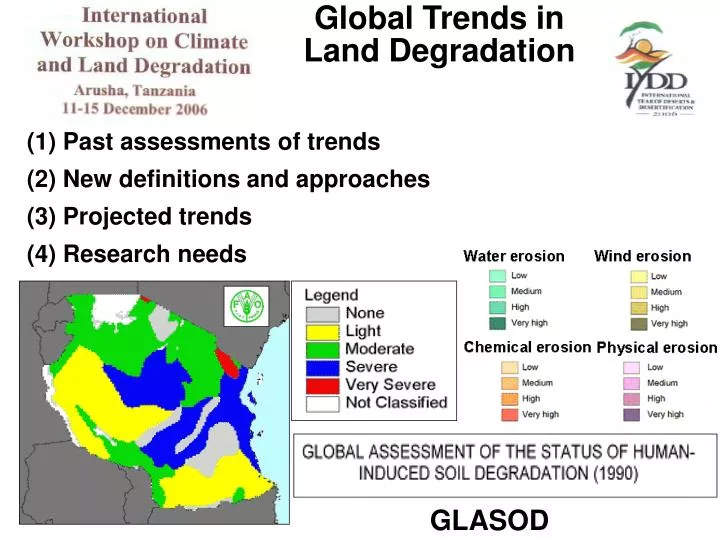
Global Trends in Land Degradation • Past assessments of trends • New definitions and approaches • Projected trends • Research needs GLASOD
Soil degradation severity Soil degradation severity and vegetation Low Soil degradation High Low High Vegetation index
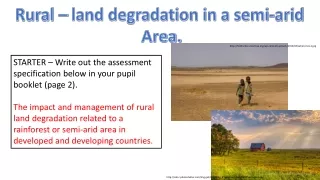
Where are the drylands? precipitation ~ 1.5 lower than evapotranspiration
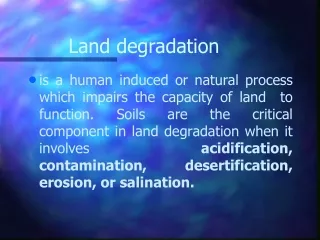
Soil degradation in Drylands = Desertification
How much of drylands is desertified? GLADOD (soil): expert opinion, travelers’ descriptions, research reports GLADOD (+ Veg. – mean of 100 monthly [1983-1990] NDVIs of highest weekly value)
MA-commissioned desk study – Erica Lepers (2003), Land-Use Land-Cover Change (IGBP’s LUCC) Not degraded Hyperarid Not dryland Dryland not covered by data • Relatively reliable literature data • Change through 1980-2000
How much of drylands is desertified? How many people are affected? Dryland not covered by data The source of differences?
susceptible may
Hyperarid Arid Semiarid Dry subhumid Humid Cold climate Desertification Degradation Susceptability Drylands • Misuse of terms • Controversial definitions • Disputed methodologies
Land degradation in the drylands A terrestrial ecosystem Loss of ecosystem services, most notably – primary production “terrestrial bio-productive system that comprises soil, vegetation, other biota, and the ecological and hydrological processes that operate within the system” “reduction or loss … of the biological … productivity … resulting from land uses …. or … combination of (other) processes, such as…” Dryland Food Fuelwood Freshwater Soil conservation Water regulation Primary production
Reduction in productivity below its potential Net Primary Productivity (NPP) Normalized Difference Vegetation Index (NDVI) Expression of desertification • Define (large) region • Obtain digitized thematic maps: • Soils • Climate • Vegetation structure • Classify region into homogenous land classes • Overlay a layer of several-years’ mean NDVIs • Highest NPPs of each land class - estimators of it potential NPP • Normalize NPP values; potential for each class = 100% • All other pixels in the class represent percentage of potential • Lowest percentages represent sites undergoing desertification
Mean NDVI of 5 years (1998-2002) SPOT-VEGETATION, 1 km2 resolution Zimbabwe Pixels of degradation Pixels of Potential NPP, non-degraded Local NPP Scaling (LNS) – Stephen Prince, Inbal Reshef
c. b. GLASOD Risk Risk Not recorded Low Moderate High Very high Biomes, soils, climate, population (NRCS ) What is the trend? Mean NDVI of 1998-2002
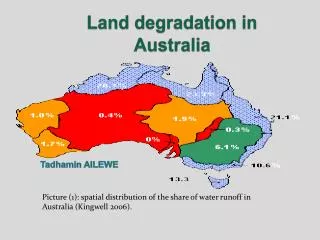
Former homelands SouthAfrica Degradation criteria: • Reduced Vegetation cover • Changed plant composition • Bush encroachment • Livestock density in communal areas twice larger than in commercial farms
Local NPP Scaling 80 70 60 40 50 03 98 92 94 86 00 89 • Define (large) region • Obtain digitized thematic maps: • Soils • Climate • Vegetation structure • Classify the region into homogenous land classes • Overlay a layer of several-years’ mean NDVIs withnon-degrading and degrading land uses 4. Overlay a layer of NDVI values for each year of a long time-series 5. Calculate annual NDVIs for pairs (degraded, non-degraded) pixels of each land class for each year of the long time-series Non-degraded sumNDVI degraded What is the source of interannual variation? 16 growing seasons
Persistent reduction in productivity 1400 1000 Rainfall (mm) 600 200 40 60 50 80 70 86 03 00 98 94 92 89 Productivity Non-degraded sumNDVI degraded 16 growing seasons
Rainfall Residual Year • Small residuals – actual NPP close to potential NPP • Large residuals – actual NPP deviates from potential NPP Residuals + NPP - Rainfall • Negative residuals – NPP lower than potential NPP • Positive residuals –NPP higher than potential NPP • As time advances – residuals more negative • Degradation increased with time during the studied period
Residual Trends (RESTREND) – Konrad Wessels and Stephen Prince - + 0 % 100% Percentage of Potential Productivity Temporal Trend of Deviation from Potential Is this persistent productivity loss irreversible? (mean 1998-2002) Local NPP Scaling (LNS)
Present Conditions & Trends 50-year projections Globalized Reactive Globalized Proactive Regionalized Reactive Regionalized Proactive Future trends Millennium Ecosystems Assessment Scenarios Globalized Transition of Global society Fragmented, Regionalized Reactive Proactive Ecosystem management approach
Poverty: Small increase Strong increase No increase Strong increase Climate Change: Time Rate of change in the extent of desertified areas Desertification trends Pressure of desertification drivers
Research needs • Detect and distinguish desertificationfrom desertification risk at all scales • Identify and detect thresholds beyond which dryland productivity change irreversibly • Decouple effects of desertification from effect of dryland’s low productivity on poverty • Quantify the feedback loops between desertification and climate change
Negev Sinai
Recovery in Negev Negev: delayed response of herders; Sinai: overgrazed Negev and Sinai overgrazed Negev recovers; Sinai overgrazed 1967 border opened 600 500 400 Number of shrubs/km2 300 200 100 1945 1976 1984 1989 1956 1968 1982 Years of airphotos Negev Sinai 1948 border closed 1982 border closed ? Tsoar et al. 1995
Soil erosion Desertification Desertification Persistent reduced productivity Biodiversity loss Climate change Climate change Vegetation changes
Less dust Less but higher intensity rain Arid dryland Negev Desert watershed Land management Agriculture Cultivation abandoned Loess sediments wind-transported from the Sahara 2m 4 m 5-10m thick 3K 1.5K 1.4K 1.2K 60K 20K 16K Late Pleistocene last pluvial phase Holocene Post-pluvial climate change Bronze age Early Islamic period Mid Pleistocene Byzantine period Peak agriculture
1984 2001 Last few centuries – Bedouin use of Byzantine terraces Some watersheds already lost most of their soil • Current rates (1990-2001)/year • Gully incision 1-23 m • Soil loss 81-818 m3 Loss since Byzantine cultivation peak – 10% of arid Negev land
100% 3K 1.5K 1.4K 1.2K 60K 20K 16K Late Pleistocene last pluvial phase Holocene Post-pluvial climate change Bronze age Early Islamic period Mid Pleistocene Byzantine period Peak agriculture 0% Agriculture window Soil for agriculture within the watershed Rocky surfaces within the watershed Runoff increase No soil for agriculture No runoff for agriculture Soil loss 0 +5,000 -15,000 Years Desertification NOT driven by human over-use NOT driven by anthropogenic global climate change But due to NATURAL climate change