Download
1 / 27
270 likes | 385 Views
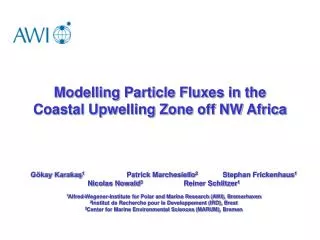
Particle transport and organic carbon fluxes off NW Africa: impact of dust and carbonate. G. Fischer (1) , M. Iversen (3, 4) , G. Karakas (3) , N. Nowald (1) , P. Helmke (2) , R. Davenport (1) , V. Ratmeyer (1) , G. Wefer (1)

E N D
Particle transport and organic carbon fluxes off NW Africa:impact of dust and carbonate G. Fischer (1), M. Iversen (3, 4), G. Karakas (3) , N. Nowald (1) , P. Helmke (2) , R. Davenport (1) , V. Ratmeyer (1) , G. Wefer (1) (1)Geosciences Department and Research Center Ocean Margins, University of Bremen, Germany (2) School of Life Sciences, Arizona State University, Tempe, Arizona, USA (3) Alfred-Wegener-Institute for Polar and Marine Research, Bremerhaven, Germany (4) Max Planck Institute for marine Microbiology, Bremen http://www.rcom.marum.de/Project_B3
Outline • Introduction • Organic carbon fluxes vs dust and carbonate off NW Africa • Sinking velocities of particles in the Atlantic and off Cape Blanc • Advective transport off NW Africa • Summary and outlook http://www.rcom.marum.de/Project_B3
Primary Production in four Eastern Boundary Current Systems (EBC‘s) Canary Current 0.3 GT C yr-1(carbonate production system with high dust supply) Carr, 2002
Winter-spring maximum of particle flux in the eastern N‘Atlantic: highest values in the Cape Blanc area CBi
Atmospheric – ocean coupling off NW Africa ? aerosol index vs lithogenic fluxes Cape Verde Annual fluxes and composition
Organic carbon and dust fluxes at four coastal sites Seasonal dust deposition from MODIS
Composition and sinking rates in the Atlanticestimated from sediment traps
Study area: the Cape Blanc filament CC CBmesoCBieu ROMS nested grid MODIS sensor: daily chl-a in december
sinking velocities: seasonal variability carbonate-dominated summer sedimentation BSi-dominated winter/spring bloom additional source 65 m d-1 250 m d-1
advection of chl-a (SeaWiFS) and deep carbon fluxes CB9 (meso) 120 m d-1 ~ 100 km/30 days 90 m d-1 Helmke et al., 2005, GBC
eu- vs mesotrophic fluxes at 1300m ~ 45 daysdelay no distinct winter/spring bloom E-W advective transport of particles of ~ 100 km / 30 days
CBi_2(eutrophic site) 730 m d-1 Flow velocimeter
Pellet sinking velocities (CBcoastal-2) CBi_2 u #10 CBi_2 l #10 Larvaceanpellets ? s.v. = 730 m d-1 400 x 1000 µm (ellipsoidal-type) 1.3 g cm-3 (quartz, coccos, diatoms) CBi_2 l #10
ROMS-simulated distributionof larger particles > 150µm of shelf origin:s.v. = 5 m d-1 Cape Blanc transect (~21°N) ‚Intermediate Nepheloid Layer (INL)‘ persistentfeatureparticles> 150 µm Karakas et al., JGR, 2006
ROMS-simulated offshore advection of particles in 400 m Particle cameraprofiles sediment trap sites
Summary and outlook • organic carbon is best coupled to carbonate ballast(except Cape Verde site) • s.v. estimated from chlorophyll and flux patterns were between65 and 250 m d-1 (larvacean pellets 730 m d-1) • flux patterns and chlorophyll distributions indicate a large advective component • particles advected from the shelf and producing an INL have s.v. of only 5-10 m d-1, but are relatively large (> 150 µm) CURRENT and FUTURE RESEARCH - define various classes of particles and their s.v. (camera, ROV sinking chamber) - in situ s.v. (ROV sinking chamber) - lab measurements of s.v. of produced aggregates (flow system) - model particle fluxes (transport–ecosystem model approach)
ROMS: Model Configuration • - 3-D hydostatic ocean model • - Parent only (8 km grid) • - Initialisation with January WOA 2001 climatology (cold start) • - 3 years spin-up with monthly COADS forcing • - QuikSCAT satellite daily winds • Nested Grid Configuration • - Etopo2 bathymetry • - Child grid 2.7 km • - 32 vertical levels
Coupled Ecosystem Model in ROMS Gruber et al., 2005
Particle distribution:observations and modelling (ROMS - ecosystem) > 150µm Karakas et al., JGR, in press
sinking velocities: regional variability 50 m d-1 25 m d-1